Identification of DNA methylation patterns predisposing for an efficient response to BCG vaccination in healthy BCG-naïve subjects - PubMed (original) (raw)
Identification of DNA methylation patterns predisposing for an efficient response to BCG vaccination in healthy BCG-naïve subjects
Jyotirmoy Das et al. Epigenetics. 2019 Jun.
Abstract
The protection against tuberculosis induced by the Bacille Calmette Guérin (BCG) vaccine is unpredictable. In our previous study, altered DNA methylation pattern in peripheral blood mononuclear cells (PBMCs) in response to BCG was observed in a subgroup of individuals, whose macrophages killed mycobacteria effectively ('responders'). These macrophages also showed production of Interleukin-1β (IL-1β) in response to mycobacterial stimuli before vaccination. Here, we hypothesized that the propensity to respond to the BCG vaccine is reflected in the DNA methylome. We mapped the differentially methylated genes (DMGs) in PBMCs isolated from responders/non-responders at the time point before vaccination aiming to identify possible predictors of BCG responsiveness. We identified 43 DMGs and subsequent bioinformatic analyses showed that these were enriched for actin-modulating pathways, predicting differences in phagocytosis. This could be validated by experiments showing that phagocytosis of mycobacteria, which is an event preceding mycobacteria-induced IL-1β production, was strongly correlated with the DMG pattern.
Keywords: BCG-vaccination; DNA methylation; Mycobacterium tuberculosis; Tuberculosis; actin regulation; phagocytosis.
Figures
Figure 1.
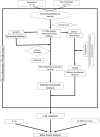
Flow chart of the data analysis approach used in this study (ellipses represent start/end point (source data), parallelograms represent input data (used databases), diamonds represent source codes (R scripts) and rectangles represent steps (results/outputs).
Figure 2.
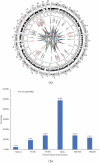
(a) Circos plot of the DMGs’chromosomal location and interaction generated using Circos (Circlize package in R v3.4). The outer circle reflects the 22 autosomes (the scale represents the chromosomal location in megabases(MB) and the circle shows the cytoband colours used in UCSC hg19 data sources (using the default parameter in ‘circlize’ package), the middle circle in black dots reflects the 414,206 Illumina probes after filtering, the inner circle indicates the chromosomal location of the 43 DMGs. The interconnections among the genes (identified using GeneMania package in Cytoscape v3.5) is shown by coloured lines. Blue: physical interactions, pink: genetic interactions, green: co-expression, violet: co-localizations among DMGs. The strengths of the interactions are shown by shades of colour from light (weak) to deep (strong). (b) Percentage of the DMGs (out of total DMGs) with altered DNA methylation pattern in the genomic positions 1st Exon, 3’UTR, 5’UTR, gene body, TSS1500, and TSS200.
Figure 3.
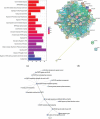
(a) The top 20 pathways identified by analysing the 43 DMGs and their first interacting gene partners using ReactomePA package in R. Enrichment based on Bonferroni-Hochberg adjusted _p_-values is shown in a colour scale of red (high enrichment) to blue (low enrichment). The length of the bar in the plot illustrates the enrichment score, reflecting the number of pathway partners in the database. Background score was calculated based on the number of genes of the functional pathway in the database to normalize the data. (b) Interaction map of a putative BCG responder-asociated module. The proteins expressed from the 43 DMGs and their first interacting neighbours (calculated from BioGrid database) were analysed using the ModuleDiscoverer package to identify the enriched cluster in the dataset, and portrayed in the STRINGdb package in R. With a score threshold cut-off of 900, the resulting network contained 651 interactions between 41 proteins; two of them (ZNF391 and NTM) without interactions. Nodes are coloured according to the log fold change ratio from red (high fold change) to green (low fold change). The overall interactions had the _p_-value≈0 calculated by the number of overall interactions over the number of expected interactions. (c). The of p75-NTR signalling network as identified from BCG responder-associated module using PathCards database. The nodes represent the associated pathways and the edges represent Jaccard similarity coefficient (J). The node size represents the distributed gene count across different sources (proportional to the number of interacting pathways), the edge length represents the proximity the neighbour, while the edge widths are proportional to the pairwise J computed for the gene contents of the entire source.
Figure 4.
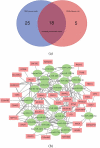
(a) Venn diagram showing the 18 genes overlapping their chromosomal positions after matching the 43 DMGs identified in the current study with the 23 DMRs reported in Sharma et.al. after 1,000,000 permutations in a randomization test. (b) Interaction network map based on the connection between 35 DMGs and 24 miRNAs that overlap between our DMG-interacting miRNAs and the previously published miRNAs linked to mycobacterial exposure of human cells or tissues. Red rectangular nodes show the DMGs and green circular nodes represent the interacting miRNAs. See also Supplementary Table 2.
Figure 5.
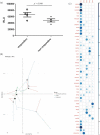
(a) Phagocytosis was measured as the number of luminescent virulent mycobacteria (arbitrary luminescence units) at 1 h post-infection of primary human macrophages. Empty symbols represent responders while the solid symbols represent the non-responders (two-tailed Student’s t-test, _p_-value = 0.046). (b) Individuals factor map obtained from the MFA using partial individual analysis. For a given individual, the symbol (as in Figure 5 (a)) corresponds to the centre of gravity for each individual, influenced by all groups of variables (the individual DMGs’ β values, phagocytosis and IL-1β, = 43+2 variables). (c) Correlation plot showed the 45 variables’ correlation distributions among five dimensions. The correlation values correspond to the quality of representations for variables on the factor map of MFA. The value was calculated as the squared coordinates, variance.cos2 = variance.coordinate × variance.coordinate. The circle size represents the value of variance.cos2 (correlation value) and the gradient of the colour scale shows the low cos2 (white) to high cos2 (blue).
Figure 6.
Schematic drawing of the proposed epigenetically different states of macrophages (Mφ). In the studied BCG-naïve population, two ‘states’ of immune cells could be identified: state 1 that does not respond effectively to the BCG vaccine (naïve state) and state 2 that has an increased capacity to ingest mycobacteria (primed state) and thereby respond efficiently to BCG by reprogramming the DNA methylome and enhance mycobactericidal effector mechanisms (the mycobactericidal state, 3). The mechanism behind the transition from state 1 to state 2 remains elusive. The transition from state 2 to state 3 can be induced through BCG vaccination.
Similar articles
- Anti-mycobacterial activity correlates with altered DNA methylation pattern in immune cells from BCG-vaccinated subjects.
Verma D, Parasa VR, Raffetseder J, Martis M, Mehta RB, Netea M, Lerm M. Verma D, et al. Sci Rep. 2017 Sep 26;7(1):12305. doi: 10.1038/s41598-017-12110-2. Sci Rep. 2017. PMID: 28951586 Free PMC article. - Characterization of immune responses of human PBMCs infected with Mycobacterium tuberculosis H37Ra: Impact of donor declared BCG vaccination history on immune responses and M. tuberculosis growth.
Bhavanam S, Rayat GR, Keelan M, Kunimoto D, Drews SJ. Bhavanam S, et al. PLoS One. 2018 Sep 11;13(9):e0203822. doi: 10.1371/journal.pone.0203822. eCollection 2018. PLoS One. 2018. PMID: 30204787 Free PMC article. - Unique gene expression profiles in infants vaccinated with different strains of Mycobacterium bovis bacille Calmette-Guerin.
Wu B, Huang C, Garcia L, Ponce de Leon A, Osornio JS, Bobadilla-del-Valle M, Ferreira L, Canizales S, Small P, Kato-Maeda M, Krensky AM, Clayberger C. Wu B, et al. Infect Immun. 2007 Jul;75(7):3658-64. doi: 10.1128/IAI.00244-07. Epub 2007 May 14. Infect Immun. 2007. PMID: 17502394 Free PMC article. - Trained innate immunity and resistance to Mycobacterium tuberculosis infection.
Koeken VACM, Verrall AJ, Netea MG, Hill PC, van Crevel R. Koeken VACM, et al. Clin Microbiol Infect. 2019 Dec;25(12):1468-1472. doi: 10.1016/j.cmi.2019.02.015. Epub 2019 Feb 23. Clin Microbiol Infect. 2019. PMID: 30807849 Review. - BCG-Induced Cross-Protection and Development of Trained Immunity: Implication for Vaccine Design.
Covián C, Fernández-Fierro A, Retamal-Díaz A, Díaz FE, Vasquez AE, Lay MK, Riedel CA, González PA, Bueno SM, Kalergis AM. Covián C, et al. Front Immunol. 2019 Nov 29;10:2806. doi: 10.3389/fimmu.2019.02806. eCollection 2019. Front Immunol. 2019. PMID: 31849980 Free PMC article. Review.
Cited by
- Deciphering a TB-related DNA methylation biomarker and constructing a TB diagnostic classifier.
Lyu M, Zhou J, Jiao L, Wang Y, Zhou Y, Lai H, Xu W, Ying B. Lyu M, et al. Mol Ther Nucleic Acids. 2021 Nov 19;27:37-49. doi: 10.1016/j.omtn.2021.11.014. eCollection 2022 Mar 8. Mol Ther Nucleic Acids. 2021. PMID: 34938605 Free PMC article. - Immune Memory in Aging: a Wide Perspective Covering Microbiota, Brain, Metabolism, and Epigenetics.
Bulut O, Kilic G, Domínguez-Andrés J. Bulut O, et al. Clin Rev Allergy Immunol. 2022 Dec;63(3):499-529. doi: 10.1007/s12016-021-08905-x. Epub 2021 Dec 15. Clin Rev Allergy Immunol. 2022. PMID: 34910283 Free PMC article. Review. - Training vs. Tolerance: The Yin/Yang of the Innate Immune System.
Lajqi T, Köstlin-Gille N, Bauer R, Zarogiannis SG, Lajqi E, Ajeti V, Dietz S, Kranig SA, Rühle J, Demaj A, Hebel J, Bartosova M, Frommhold D, Hudalla H, Gille C. Lajqi T, et al. Biomedicines. 2023 Mar 2;11(3):766. doi: 10.3390/biomedicines11030766. Biomedicines. 2023. PMID: 36979747 Free PMC article. Review. - Microbiota, Epigenetics, and Trained Immunity. Convergent Drivers and Mediators of the Asthma Trajectory from Pregnancy to Childhood.
Lynch SV, Vercelli D. Lynch SV, et al. Am J Respir Crit Care Med. 2021 Apr 1;203(7):802-808. doi: 10.1164/rccm.202010-3779PP. Am J Respir Crit Care Med. 2021. PMID: 33493428 Free PMC article. No abstract available. - BCG-induced protection against Mycobacterium tuberculosis infection: Evidence, mechanisms, and implications for next-generation vaccines.
Foster M, Hill PC, Setiabudiawan TP, Koeken VACM, Alisjahbana B, van Crevel R. Foster M, et al. Immunol Rev. 2021 May;301(1):122-144. doi: 10.1111/imr.12965. Epub 2021 Mar 12. Immunol Rev. 2021. PMID: 33709421 Free PMC article. Review.
References
- Smith ZD, Meissner A.. DNA methylation: roles in mammalian development. Nat Rev Genet. 2013;14:204–220. - PubMed
- Jones PA, Takai D.. The role of DNA methylation in mammalian epigenetics. Science. 2001;293:1068–1070. - PubMed
- Lerm M, Netea MG. Trained immunity: a new avenue for tuberculosis vaccine development. J Intern Med. 2016;279:337–346. - PubMed
Publication types
MeSH terms
Substances
Grants and funding
This work was supported by the Hjärt-Lungfonden [20130685]; Hjärt-Lungfonden [20150709]; Vetenskapsrådet [2015-02593]; Vetenskapsrådet [2012-3349].
LinkOut - more resources
Full Text Sources
Other Literature Sources
Medical
Molecular Biology Databases
