Fyn kinase regulates misfolded α-synuclein uptake and NLRP3 inflammasome activation in microglia - PubMed (original) (raw)
. 2019 Jun 3;216(6):1411-1430.
doi: 10.1084/jem.20182191. Epub 2019 Apr 29.
Nikhil Panicker 1 2 3, Dilshan S Harischandra 1, Matthew Neal 1, Tae-In Kam 2 3, Huajun Jin 1, Hariharan Saminathan 1, Monica Langley 1, Adhithiya Charli 1, Manikandan Samidurai 1, Dharmin Rokad 1, Shivani Ghaisas 1, Olga Pletnikova 4, Valina L Dawson 2 3 5 6, Ted M Dawson 2 3 5 7, Vellareddy Anantharam 1, Anumantha G Kanthasamy 8, Arthi Kanthasamy 9
Affiliations
- PMID: 31036561
- PMCID: PMC6547864
- DOI: 10.1084/jem.20182191
Fyn kinase regulates misfolded α-synuclein uptake and NLRP3 inflammasome activation in microglia
Nikhil Panicker et al. J Exp Med. 2019.
Abstract
Persistent microglia-mediated neuroinflammation is a major pathophysiological contributor to the progression of Parkinson's disease (PD), but the cell-signaling mechanisms governing chronic neuroinflammation are not well understood. Here, we show that Fyn kinase, in conjunction with the class B scavenger receptor CD36, regulates the microglial uptake of aggregated human α-synuclein (αSyn), which is the major component of PD-associated Lewy bodies. αSyn can effectively mediate LPS-independent priming and activation of the microglial NLRP3 inflammasome. Fyn kinase regulates both of these processes; it mediates PKCδ-dependent NF-κB-p65 nuclear translocation, leading to inflammasome priming, and facilitates αSyn import into microglia, contributing to the generation of mitochondrial reactive oxygen species and consequently to inflammasome activation. In vivo experiments using A53T and viral-αSyn overexpression mouse models as well as human PD neuropathological results further confirm the role of Fyn in NLRP3 inflammasome activation. Collectively, our study identifies a novel Fyn-mediated signaling mechanism that amplifies neuroinflammation in PD.
© 2019 Panicker et al.
Figures
Figure 1.
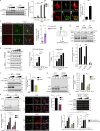
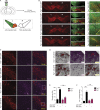
Fyn and CD36 contribute to aggregated αSyn uptake into microglia. (A) Immunoblot analysis of aggregated αSyn-treated WT and Fyn−/− microglial lysates reveals a rapid induction of SFK activity in WT, but not Fyn−/−, microglia. Error bars represent mean ± SEM. One-way ANOVA followed by Tukey’s post hoc test (n = 3). Con, control. (B) ICC reveals rapid increase in p-Y416 SFK levels in αSyn-treated Iba-1–positive WT microglial cells. Scale bars, 15 µm. Error bars represent mean ± SEM. Unpaired two-tailed t test (n = 4). (C) IHC analysis to show microglial Fyn activation in the AAV-SYN model at 30 d. Schematic of AAV injection on the side. Scale bars, 15 µm. Error bars represent mean ± SEM. Unpaired two-tailed t test (n = 4 mice per group). (D) Upon its application to microglial cells, αSyn associates with TLR2 and CD36, as evidenced by coIP analysis. Upon αSyn treatment, Fyn associates with CD36, but not TLR2. Error bars represent mean ± SEM. One-way ANOVA followed by Tukey’s post hoc test (n = 3). IP, immunoprecipitation. (E) Immunoprecipitation of FLAG-tagged human CD36 in αSyn-treated HEK cells shows a transient interaction of CD36 and αSyn. Error bars represent mean ± SEM. One-way ANOVA followed by Tukey’s post hoc test (n = 3). IB, immunoblotting. (F) Immunoblot for p-Y416 SFK reveals that Fyn activation occurs downstream of CD36. Error bars represent mean ± SEM. Unpaired two-tailed t test (n = 3). (G) Immunoblot analysis showing diminished αSyn uptake by CD36−/− BMDMs. Error bars represent mean ± SEM. One-way ANOVA followed by Tukey’s post hoc test (n = 3). (H) Immunoblot analysis also reveals that reduced αSyn was taken up by Fyn−/− microglia. Error bars represent mean ± SEM. One-way ANOVA followed by Tukey’s post hoc test (n = 5). (I and J) ICC for human αSyn revealed diminished uptake of the protein in Fyn-deficient microglia. Error bars represent mean ± SEM. Unpaired two-tailed t test (n = 5). Scale bars, 15 µm. (K) Whole-cell lysate analysis from αSyn-treated, WT-transfected, and activation loop–deficient (Y417A) Fyn-FLAG–transfected cells showed diminished αSyn uptake in inactive Fyn mutant–expressing cells. Error bars represent mean ± SEM. One-way ANOVA followed by Tukey’s post hoc test (n = 3). Asterisks indicate the level of statistical significance: ns, not significant; *, P ≤ 0.05; **, P ≤ 0.01; ***, P ≤ 0.001.
Figure 2.
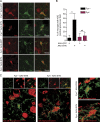
Microglial Fyn activation in human PD brains. (A) Significantly increased Fyn expression and activation were observed in AAV-SYN–injected nigral lysates, as assessed by immunoblots. Error bars represent mean ± SEM. Unpaired two-tailed t test (n = 4 mice per group). (B) IHC analysis revealed Fyn induction in Iba-1–positive microglia in AAV-SYN–injected nigral brain sections. Scale bars, 30 µm. (C) Significant increase in Fyn expression and activation in PD ventral midbrain lysates, when compared with age-matched control lysates. Representative immunoblot is shown. Error bars represent mean ± SEM. Unpaired two-tailed t test (n = 12). (D) IHC analysis of PD brain sections revealed strongly increased p-Y416 SFK expression within Iba-positive microglia when compared with age-matched non-PD brain sections. Error bars represent mean ± SEM. Unpaired two-tailed t test (n = 6). Scale bars, 15 µm. (E) IHC shows increased microglial Fyn expression in PD ventral midbrain sections. Scale bars, 15 µm. Error bars represent mean ± SEM. Unpaired two-tailed t test (n = 6). Asterisks indicate the level of statistical significance: *, P ≤ 0.05; ***, P ≤ 0.001.
Figure 3.
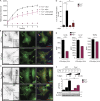
Fyn-dependent αSyn uptake into microglial cells induces mitochondrial ROS generation. (A) MitoSOX assay shows diminished mitoROS generation from αSyn-treated Fyn−/− microglia. Error bars represent mean ± SEM. One-way ANOVA followed by Tukey’s post hoc test (n = 3). (B and C) ICC analysis reveals diminished mitochondrial morphology deficits observed in the aggregated αSyn-treated Fyn−/− microglia. Scale bars, 15 µm. Con, control. (D) Quantification of mitochondrial circularity. Error bars represent mean ± SEM. One-way ANOVA followed by Tukey’s post hoc test (n = 3). (E) LPS-primed αSyn-treated WT microglia produced higher amounts of proinflammatory cytokines than Fyn-deficient microglia, as evidenced by Luminex supernatant analysis. Error bars represent mean ± SEM. Unpaired two-tailed t test (n = 4). (F) αSyn treatment induced the production of supernatant nitrite and NOS2, as evidenced by Griess assay and immunoblots, respectively, but did so to a significantly lesser extent in Fyn-deficient microglia. Error bars represent mean ± SEM. One-way ANOVA followed by Tukey’s post hoc test (n = 3). Asterisks indicate the level of statistical significance: *, P ≤ 0.05; **, P ≤ 0.01; ***, P ≤ 0.001.
Figure 4.
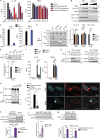
αSyn can prime and activate the NLRP3 inflammasome to mediate IL-1β production. (A) Luminex analysis shows that αSyn treatment elicited IL-1β production from unprimed microglial cells, which could be inhibited in a dose-dependent manner by inhibitors of the NLRP3 inflammasome, Casp-1 and Fyn. Fyn inhibition also inhibited αSyn-mediated TNFα production. Error bars represent mean ± SEM. One-way ANOVA followed by Tukey’s post hoc test (n = 5). (B) αSyn induced Casp-1–independent induction of pro–IL-1β and NLRP3 levels, as evidenced by immunoblot analysis from αSyn-treated WT and Casp-1−/− microglial cell lysates. (C) Luminex analysis shows αSyn treatment induced Casp-1–dependent production of IL-1β, but not TNFα, from microglial cells. Error bars represent mean ± SEM. One-way ANOVA followed by Tukey’s post hoc test (n = 3). (D) NLRP3−/−, ASC−/−, and Casp-1−/− BMDMs exhibited similar αSyn-induced production of pro–IL-1β and uptake of αSyn but almost completely attenuated Casp-1 cleavage, as shown by immunoblots. Error bars represent mean ± SEM. One-way ANOVA followed by Tukey’s post hoc test (n = 3). (E) αSyn induced Casp-1 p20 secretion in WT, but not NLRP3−/−, ASC−/−, and Casp-1−/− BMDM supernatants, as shown by supernatant (SN) immunoblot. Error bars represent mean ± SEM. One-way ANOVA followed by Tukey’s post hoc test (n = 3). (F) αSyn-mediated production of IL-1β, but not TNFα, was strongly attenuated in NLRP3−/−, ASC−/−, and Casp-1−/− but minimally affected in Casp-11−/− BMDM supernatants, indicating that αSyn both primes and activates the NLRP3 inflammasome primarily through its canonical activation, as shown by Luminex analysis. Error bars represent mean ± SEM. One-way ANOVA followed by Tukey’s post hoc test (n = 5). Con, control. (G) Supernatant immunoblot analysis shows that WT, but not Casp1−/− and NLRP3−/− primary microglia, secrete IL-1β upon αSyn treatment. (H) Endotoxin-free aggregated mouse αSyn was able to elicit Casp-1 cleavage and secretion in WT microglia, and this was blocked with MCC 950 pretreatment. MCC 950 had no effect on NLRP3 induction in whole-cell lysates, as shown via immunoblots. (I) Endotoxin-free aggregated mouse αSyn was able to elicit IL-1β secretion from WT microglia, and this was substantially blocked upon MCC 950 pretreatment, as assessed via ELISA for IL-1β. Error bars represent mean ± SEM. One-way ANOVA followed by Tukey’s post hoc test (n = 3). (J) ICC shows aggregated αSyn treatment induced ASC speck formation in the ASC-CFP reporter cell line. Scale bars, 15 µm. (K) Immunoblot analysis of 4-mo-old A53T nigral lysates revealed a significant increase in the levels of cleaved Casp-1 levels when compared with littermate controls. Bars represent mean ± SEM. Unpaired two-tailed t test (n = 4 mice per group). (L) Immunoblot analysis shows increased cleaved Casp-1 levels in AAV-SYN nigral lysates. Error bars represent mean ± SEM. Unpaired two-tailed t test (n = 4 mice per group). (M) Immunoblot analysis of PD nigral tissue lysates revealed significantly increased IL-1β and Casp-1 p20 levels when compared with age-matched control nigral lysates. Error bars represent mean ± SEM. Unpaired two-tailed t test (n = 3). Asterisks indicate the level of statistical significance: ns, not significant; *, P ≤ 0.05; **, P ≤ 0.01; ***, P ≤ 0.001.
Figure 5.
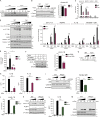
Fyn contributes to αSyn-mediated priming of the NLRP3 inflammasome, resulting in diminished production of IL-1β and other pro-inflammatory cytokines. (A) Immunoblot analysis of aggregated αSyn-treated WT and Fyn−/− microglial lysates reveals a rapid induction of pY311-PKCδ levels in WT, but not Fyn−/−, microglia. (B) Diminished αSyn-induced nuclear translocation of NF-κB-p65 in Fyn−/− microglial cells, as shown by immunoblot analysis of nuclear fractions. Error bars represent mean ± SEM. Unpaired two-tailed t test (n = 3). (C) Diminished induction of pro–IL-1β and NLRP3 mRNA levels in Fyn-deficient microglia upon αSyn treatment, as shown by qRT-PCR. Error bars represent mean ± SEM. One-way ANOVA followed by Tukey’s post hoc test (n = 3). (D) Reduced induction of pro–IL-1β and NLRP3 protein levels, as well as Casp-1 and IL-1β cleavage, in Fyn−/− microglia, as demonstrated by immunoblot analysis. Error bars represent mean ± SEM. One-way ANOVA followed by Tukey’s post hoc test (n = 4). Con, control. (E) FLICA assay revealed strongly increased Casp-1 activation in αSyn-treated WT, but not Fyn−/−, microglia. Error bars represent mean ± SEM. One-way ANOVA followed by Tukey’s post hoc test (n = 3). (F) Knocking down Fyn using siRNA reduces αSyn-mediated induction of pro–IL-1β in primary WT microglia, as shown by immunoblot. Error bars represent mean ± SEM. Unpaired two-tailed t test (n = 3). (G and H) Supernatant immunoblot and Luminex show reduced supernatant levels of IL-1β and other proinflammatory cytokines from αSyn-treated Fyn−/− microglia. Error bars represent mean ± SEM. One-way ANOVA followed by Tukey’s post hoc test (n = 3). (I) Reduced aggregated αSyn-mediated p65 nuclear translocation seen in PKCδ−/− microglia, as shown by immunoblot analysis of nuclear fractions. Error bars represent mean ± SEM. Unpaired two-tailed t test (n = 3). (J) qRT-PCR shows attenuated αSyn-induced pro–IL-1β mRNA induction in PKCδ-deficient microglia. Error bars represent mean ± SEM. One-way ANOVA followed by Tukey’s post hoc test (n = 3). (K and L) Reduced induction of pro–IL-1β and NLRP3 proteins (verified by immunoblot; K) and secretion of IL-1β (checked via Luminex; L) from PKCδ−/− microglia. Error bars represent mean ± SEM. One-way ANOVA followed by Tukey’s post hoc test (n = 3). (M) No change in the import of aggregated αSyn observed between PKCδ+/+ and PKCδ−/− microglia, as shown by immunoblot analysis. Asterisks indicate the level of statistical significance: ns, not significant; *, P ≤ 0.05; **, P ≤ 0.01; ***, P ≤ 0.001.
Figure 6.
Diminished microgliosis activation in Fyn-deficient mice using the AAV-SYN PD model. (A) Representational diagram of AAV injection site in mice (left [L] and right [R]). VTA, ventral tegmental area. (B) Stereotaxic injection of AAV-GFP– and AAV-SYN–overexpressing particles into the SNpc resulted in specific targeting of SNpc dopaminergic neurons, as indicated by a colocalization of TH and GFP/human αSyn expression. Scale bars, 500 µm (left panel) and 100 µm (right panel). (C) IHC analysis shows massive microgliosis within the SNpc of Fyn+/+ mice injected with the AAV-SYN particles, but not in Fyn−/− mice. Scale bars, 100 µm. (D) 3D reconstruction of the Z-stack images in the ventral midbrain of AAV-SYN–injected WT and Fyn−/− reveals contrasting microglial response between the genotypes. Scale bars, 20 µm. (E) Quantification of the number of microglia per field in the SNpc in AAV-GFP– or AAV-SYN–injected Fyn+/+ and Fyn−/− ventral midbrain sections. Error bars represent mean ± SEM. One-way ANOVA followed by Tukey’s post hoc test (n = 5 mice per group). (F) Quantification of the number of microglia Iba-1 staining intensity in the SNpc in AAV-GFP– or AAV-SYN–injected Fyn+/+ and Fyn−/− ventral midbrain sections. Error bars represent mean ± SEM. One-way ANOVA followed by Tukey’s post hoc test (n = 5 mice per group). Asterisks indicate the level of statistical significance: ***, P ≤ 0.001.
Figure 7.
Reduced αSyn-induced NLRP3 inflammasome activation in Fyn-deficient mice. (A) AAV-SYN injection in Fyn+/+, but not Fyn−/−, mice elicits microglial ASC speck formation in the ventral midbrain, as seen by double IHC for Iba-1 and ASC. Scale bars, 15 µm. (B) Quantification of the midbrain ASC specks upon AAV-GFP or AAV-SYN injection in Fyn+/+ and Fyn−/− ventral midbrain sections. Error bars represent mean ± SEM. One-way ANOVA followed by Tukey’s post hoc test (n = 5 mice per group). (C) 3D reconstruction of microglial ASC expression in AAV-SYN–injected Fyn+/+ and Fyn−/− mouse ventral midbrain sections. Asterisks indicate the level of statistical significance: *, P ≤ 0.05; ns, not significant. Scale bars, 15 µm.
Figure 8.
Aggregated αSyn-mediated NLRP3 inflammasome activation pathway. αSyn binds to the receptors TLR-2 and CD36 on microglial cells. CD36 recruits Fyn kinase, which is activated, and subsequently tyrosine phosphorylates PKCδ at Y311, leading to increased PKCδ-dependent activation of the NF-κB pathway. p65 translocates to the nucleus and brings about the induction of pro–IL-1β and NLRP3 mRNAs. Aggregated αSyn is taken up by the microglia, after which it brings about mitochondrial dysfunction–mediated activation of the NLRP3 inflammasome. Fyn, but not PKCδ, contributes to this process as well.
Similar articles
- Targeting Microglial α-Synuclein/TLRs/NF-kappaB/NLRP3 Inflammasome Axis in Parkinson's Disease.
Li Y, Xia Y, Yin S, Wan F, Hu J, Kou L, Sun Y, Wu J, Zhou Q, Huang J, Xiong N, Wang T. Li Y, et al. Front Immunol. 2021 Oct 8;12:719807. doi: 10.3389/fimmu.2021.719807. eCollection 2021. Front Immunol. 2021. PMID: 34691027 Free PMC article. Review. - Fyn Kinase Regulates Microglial Neuroinflammatory Responses in Cell Culture and Animal Models of Parkinson's Disease.
Panicker N, Saminathan H, Jin H, Neal M, Harischandra DS, Gordon R, Kanthasamy K, Lawana V, Sarkar S, Luo J, Anantharam V, Kanthasamy AG, Kanthasamy A. Panicker N, et al. J Neurosci. 2015 Jul 8;35(27):10058-77. doi: 10.1523/JNEUROSCI.0302-15.2015. J Neurosci. 2015. PMID: 26157004 Free PMC article. - Inflammasome inhibition prevents α-synuclein pathology and dopaminergic neurodegeneration in mice.
Gordon R, Albornoz EA, Christie DC, Langley MR, Kumar V, Mantovani S, Robertson AAB, Butler MS, Rowe DB, O'Neill LA, Kanthasamy AG, Schroder K, Cooper MA, Woodruff TM. Gordon R, et al. Sci Transl Med. 2018 Oct 31;10(465):eaah4066. doi: 10.1126/scitranslmed.aah4066. Sci Transl Med. 2018. PMID: 30381407 Free PMC article. - Soluble α-synuclein-antibody complexes activate the NLRP3 inflammasome in hiPSC-derived microglia.
Trudler D, Nazor KL, Eisele YS, Grabauskas T, Dolatabadi N, Parker J, Sultan A, Zhong Z, Goodwin MS, Levites Y, Golde TE, Kelly JW, Sierks MR, Schork NJ, Karin M, Ambasudhan R, Lipton SA. Trudler D, et al. Proc Natl Acad Sci U S A. 2021 Apr 13;118(15):e2025847118. doi: 10.1073/pnas.2025847118. Proc Natl Acad Sci U S A. 2021. PMID: 33833060 Free PMC article. - NF-κB/NLRP3 inflammasome axis and risk of Parkinson's disease in Type 2 diabetes mellitus: A narrative review and new perspective.
Alrouji M, Al-Kuraishy HM, Al-Gareeb AI, Alexiou A, Papadakis M, Jabir MS, Saad HM, Batiha GE. Alrouji M, et al. J Cell Mol Med. 2023 Jul;27(13):1775-1789. doi: 10.1111/jcmm.17784. Epub 2023 May 21. J Cell Mol Med. 2023. PMID: 37210624 Free PMC article. Review.
Cited by
- Fyn Kinase-Mediated PKCδ Y311 Phosphorylation Induces Dopaminergic Degeneration in Cell Culture and Animal Models: Implications for the Identification of a New Pharmacological Target for Parkinson's Disease.
Saminathan H, Ghosh A, Zhang D, Song C, Jin H, Anantharam V, Kanthasamy A, Kanthasamy AG. Saminathan H, et al. Front Pharmacol. 2021 Apr 28;12:631375. doi: 10.3389/fphar.2021.631375. eCollection 2021. Front Pharmacol. 2021. PMID: 33995031 Free PMC article. - Sublytic C5b-9 Induces CCL3/4 Production and Macrophage Accumulation in Thy-1N Rats via PKC-α/p65/IRF-8 Axis.
Wang W, Qian B, Zhao C, Peng M, Liu L, Xie M, Peng N, He Q, Ying S, Zhu Y, Wang T, Hu D, Zhao D, Zhang J, Wang Y, Qiu W. Wang W, et al. Int J Biol Sci. 2022 May 1;18(8):3178-3193. doi: 10.7150/ijbs.69652. eCollection 2022. Int J Biol Sci. 2022. PMID: 35637950 Free PMC article. - Peptide aptamer targeting Aβ-PrP-Fyn axis reduces Alzheimer's disease pathologies in 5XFAD transgenic mouse model.
Ali T, Klein AN, Vu A, Arifin MI, Hannaoui S, Gilch S. Ali T, et al. Cell Mol Life Sci. 2023 May 7;80(6):139. doi: 10.1007/s00018-023-04785-w. Cell Mol Life Sci. 2023. PMID: 37149826 Free PMC article. - Neurodegenerative Disease and the NLRP3 Inflammasome.
Holbrook JA, Jarosz-Griffiths HH, Caseley E, Lara-Reyna S, Poulter JA, Williams-Gray CH, Peckham D, McDermott MF. Holbrook JA, et al. Front Pharmacol. 2021 Mar 10;12:643254. doi: 10.3389/fphar.2021.643254. eCollection 2021. Front Pharmacol. 2021. PMID: 33776778 Free PMC article. Review. - Inflammasomes in neurological disorders - mechanisms and therapeutic potential.
Ravichandran KA, Heneka MT. Ravichandran KA, et al. Nat Rev Neurol. 2024 Feb;20(2):67-83. doi: 10.1038/s41582-023-00915-x. Epub 2024 Jan 9. Nat Rev Neurol. 2024. PMID: 38195712 Review.
References
- Baroja-Mazo A., Martín-Sánchez F., Gomez A.I., Martínez C.M., Amores-Iniesta J., Compan V., Barberà-Cremades M., Yagüe J., Ruiz-Ortiz E., Antón J., et al. . 2014. The NLRP3 inflammasome is released as a particulate danger signal that amplifies the inflammatory response. Nat. Immunol. 15:738–748. 10.1038/ni.2919 - DOI - PubMed
Publication types
MeSH terms
Substances
Grants and funding
- P30 NS050274/NS/NINDS NIH HHS/United States
- P50 AG005146/AG/NIA NIH HHS/United States
- R01 NS100090/NS/NINDS NIH HHS/United States
- U01 NS112008/NS/NINDS NIH HHS/United States
- R01 ES026892/ES/NIEHS NIH HHS/United States
- R01 NS088206/NS/NINDS NIH HHS/United States
LinkOut - more resources
Full Text Sources
Molecular Biology Databases
Miscellaneous
