Genetic diversity of tumors with mismatch repair deficiency influences anti-PD-1 immunotherapy response - PubMed (original) (raw)
. 2019 May 3;364(6439):485-491.
doi: 10.1126/science.aau0447.
Rajarsi Mandal # 1 2 3, Ken-Wing Lee # 3, Jonathan J Havel 3 5, Hao Wang 6, Chirag Krishna 7, Erich Y Sabio 3, Vladimir Makarov 3 5, Fengshen Kuo 5, Pedro Blecua 4, Apoorva T Ramaswamy 8, Jennifer N Durham 2 6 9, Bjarne Bartlett 9, Xiaoxiao Ma 3, Raghvendra Srivastava 5, Sumit Middha 10, Ahmet Zehir 10, Jaclyn F Hechtman 10, Luc Gt Morris 3 5 11, Nils Weinhold 4, Nadeem Riaz 3 4 5, Dung T Le 2 6 9, Luis A Diaz Jr 5 12, Timothy A Chan 13 4 5
Affiliations
- PMID: 31048490
- PMCID: PMC6685207
- DOI: 10.1126/science.aau0447
Genetic diversity of tumors with mismatch repair deficiency influences anti-PD-1 immunotherapy response
Rajarsi Mandal et al. Science. 2019.
Abstract
Tumors with mismatch repair deficiency (MMR-d) are characterized by sequence alterations in microsatellites and can accumulate thousands of mutations. This high mutational burden renders tumors immunogenic and sensitive to programmed cell death-1 (PD-1) immune checkpoint inhibitors. Yet, despite their tumor immunogenicity, patients with MMR-deficient tumors experience highly variable responses, and roughly half are refractory to treatment. We present experimental and clinical evidence showing that the degree of microsatellite instability (MSI) and resultant mutational load, in part, underlies the variable response to PD-1 blockade immunotherapy in MMR-d human and mouse tumors. The extent of response is particularly associated with the accumulation of insertion-deletion (indel) mutational load. This study provides a rationale for the genome-wide characterization of MSI intensity and mutational load to better profile responses to anti-PD-1 immunotherapy across MMR-deficient human cancers.
Copyright © 2019 The Authors, some rights reserved; exclusive licensee American Association for the Advancement of Science. No claim to original U.S. Government Works.
Figures
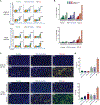
Fig. 1.. Generation of microsatellite instability and tumor mutational burden after anti-PD-1 therapy.
(A) Experimental model system for creating MSI-intermediate versus MSI-high tumor cell lines. Msh2 knockout B16F10 mouse melanoma and CT26 mouse colon cancer cell lines were passaged as illustrated. The unedited parental line was passaged in parallel and served as a control. Blue receptors on cells represent MHC complexes presenting self (black) or neoantigens (colors). (B) Absolute number of novel nonsynonymous single-nucleotide variations (SNVs) and coding region indel mutations observed beyond what was present in the parental unedited line in MSI-intermediate (low-passage) and MSI-high (high-passage) lines. (C) Increased genomic MSI intensity levels in MSI-intermediate and MSI-high cell lines quantified through the use of the MSIsensor algorithm on whole-exome sequencing (150×) data (B16F10 MSI-intermediate line p = 0.0028, all other lines p < 0.0001). Fisher’s exact test was used to compare proportions of unstable microsatellites between the indicated groups and respective parental lines. (D) Increased percentage of novel exonic indel mutations out of total mutations in MSI-high lines as compared to the MSI-intermediate cell lines (p = 0.003, p < 0.0001). Fisher’s exact test was used to compare proportions of novel exonic indels between the indicated groups. (E) In vivo tumor growth kinetics in isotype control antibody–treated and murine anti–PD-1–treated parental, MSI-intermediate, and MSI-high tumor-bearing mice over a 24-day period. B16F10 cell line: p = 0.001 (parental), p = 0.01 (MSI-intermediate), p < 0.000001 (MSI-high); CT26 cell line: p = ns (parental), p = ns (MSI-intermediate), p < 0.0000001 (MSI-high). Student’s t test was used for the comparison of tumor volume at 24 days after treatment. P value was adjusted by Holm Sidak correction for testing at multiple time points. Data shown as mean ± SEM, n = 8 to 12 mice per experimental arm.
Fig. 2.. Immune cell infiltration drives variable responses to anti–PD-1 therapy in MSI-high tumors.
(A) Representative flow cytometric data quantifying CD45+CD3+ T cell infiltration in pooled tumor samples (n = 6 to 7 tumors per arm) resected at day 24 from each experimental arm in isotype control antibody–treated and murine anti–PD-1–treated parental, MSI-intermediate, and MSI-high tumor lines.(B) Percentage tumor infiltration of CD4+, CD8+, and total CD3+ T cell infiltration in isotype control–treated (dark colors) and anti–PD-1–treated (light colors) tumor-bearing mice in all experimental arms (n = 6 to7 tumors per arm). (C) Representative photographs from immunofluorescence (IF) staining of isotype control–treated and murine anti–PD-1–treated parental, MSI-intermediate, and MSI-high tumor lines. Yellow, CD3+, tumor nuclei are stained with DAPI (blue). Scale bars, 50 mm. (D) Mean CD3+ T cell counts per high-power field from five representative fields from each experimental arm [shown in(C)], quantified by two trained observers blinded to the treatment and experimental arm. Significance values: **p < 0.01, ****p < 0.0001 versus parental isotype control–treated, one-way analysis of variance (ANOVA) with Dunnett’s multiple comparisons test for comparisons to a single control group (parental isotype treatment).
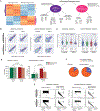
Fig. 3.. Tumor mutational evolution and immunoediting in anti–PD-1–treated MSI tumors.
(A) Unsupervised hierarchical clustering of differentially expressed genes demonstrating enrichment of immune-related pathways (cluster 1) in MSI-high anti–PD-1–treated tumors as compared to MSI-high isotype control–treated tumors. Up-regulation of the stromal and tumor-associated genes (cluster 2) seen in MSI-high isotype control-treated tumors as compared to the MSI-high anti–PD-1–treated tumors. (B) Tumor mutational allele frequency (purity-corrected) in isotype control–treated and anti–PD-1–treated parental and MSI-high B1610 tumor cells before implantation (x axis) and post-therapy (y axis). Data points represent mutations (650× mean coverage) in isotype control–treated and anti–PD-1–treated parental (n = 102, 106 indels; 2291, 2273 SNVs) and MSI-high B16F10(n = 233, 176 indels; 2502, 2442 SNVs) tumor cells before or after therapy. (C) Violin plots depicting frequency distribution (purity-corrected) of missense (nonsynonymous SNVs) and indel mutations in post-therapy B16F10 tumors in the parental and MSI-high lines (p values for significant differences shown as indicated between groups, one-way ANOVA with Tukey’s test for pairwise comparisons). (D) Reduction in mutational load (missense and indel counts) in post-therapy isotype control and anti–PD-1–treated parental and MSI-high tumors (p < 0.0001, Fisher’s exact test for proportions of lost or gained mutations after antibody treatment between the indicated groups). (E) Changes in tumor allele frequency of individual missense and indel mutations in isotype control and anti–PD-1–treated MSI-high tumors that were either (i) preexisting in the parental line or (ii) generated in vitro through MMR deficiency [p < 0.0001; all comparisons are of percentage deletion (proportional loss) after anti–PD-1 therapy of baseline versus MMR-d–induced mutations, Fisher’s exact test].(F) Percentages of MMR-d–induced mutations persisting after isotype control treatment that are deleted (edited) upon addition of anti–PD-1 treatment (p < 0.0001, Fisher’s exact test to compare the proportions of lost or edited MMR-d–induced mutations after PD-1 blockade between SNV and indel mutational groups).
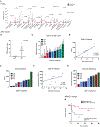
Fig. 4.. Increasing microsatellite instability intensity predicts tumor response to immune checkpoint blockade therapy in human clinical data.
(A) Immune cytolytic (CYT) score across14 human cancers derived from TCGA sequencing data stratified by MSI-Low (red) and MSI-High (blue) status. MSI designation derived from MSIsensor score using a threshold score of 3.5. All box-and-whisker plots represent the median (solid bars), interquartile range (boxes), and 1.5× interquartile range (dashed lines); p values shown as indicated between groups, Mann-Whitney U test. (B) MSIsensor scores in clinically designated microsatellite stable colorectal tumors as compared to clinically designated microsatellite unstable colorectal tumors (p = 0.002, unpaired t test; data shown as mean ± SEM). (C) MSIsensor scores and clinical response designation within MMR-d/MSI-H patients; each bar represents one patient and is annotated with their known tumor or germline MMR genetic alteration. CR (complete response, green), PR (partial response, blue), SD (stable disease, teal), PD (progressive disease, red). (D) Mutational indel load versus MSIsensor score among MMR-d/MSI-H patients (r = 0.8045, p = 0.0089). (E) Tumor indel load and clinical response designation within MMR-d/MSI-H patients; each bar represents one patient. (F) Nonsynonymous SNV (missense) load versus MSIsensor score among MMR-d/MSI-H patients (r = 0.3994, p = 0.2867). (G) Tumor nonsynonymous SNV load and clinical response designation within MMR-d/MSI-H patients; each bar represents one patient. (H) Overall survival in immune checkpoint blockade–treated MMR-deficient patients stratified by MMR-d/MSI-Intermediate (blue) designation (bottom 20th percentile of MSIsensor scores) and MMR-d/MSI-High (red) designation (top 80th percentile of MSIsensor scores) (log-rank test p = 0.0032, hazard ratio = 0.147, log rank).
Similar articles
- Why is immunotherapy effective (or not) in patients with MSI/MMRD tumors?
Nebot-Bral L, Coutzac C, Kannouche PL, Chaput N. Nebot-Bral L, et al. Bull Cancer. 2019 Feb;106(2):105-113. doi: 10.1016/j.bulcan.2018.08.007. Epub 2018 Oct 17. Bull Cancer. 2019. PMID: 30342749 Review. - Mismatch repair deficiency/microsatellite instability-high as a predictor for anti-PD-1/PD-L1 immunotherapy efficacy.
Zhao P, Li L, Jiang X, Li Q. Zhao P, et al. J Hematol Oncol. 2019 May 31;12(1):54. doi: 10.1186/s13045-019-0738-1. J Hematol Oncol. 2019. PMID: 31151482 Free PMC article. Review. - DNA mismatch repair in cancer.
Baretti M, Le DT. Baretti M, et al. Pharmacol Ther. 2018 Sep;189:45-62. doi: 10.1016/j.pharmthera.2018.04.004. Epub 2018 Apr 15. Pharmacol Ther. 2018. PMID: 29669262 Review. - Tumor Molecular Testing Guides Anti-PD-1 Therapy and Provides Evidence for Pathogenicity of Mismatch Repair Variants.
Patel SA, Longacre TA, Ladabaum U, Lebensohn A, Lin AY, Haraldsdottir S. Patel SA, et al. Oncologist. 2018 Dec;23(12):1395-1400. doi: 10.1634/theoncologist.2018-0108. Epub 2018 Aug 2. Oncologist. 2018. PMID: 30072391 Free PMC article. - Microsatellite Instability Predicts Response to Anti-PD1 Immunotherapy in Metastatic Melanoma.
Roncati L. Roncati L. Acta Dermatovenerol Croat. 2018 Dec;26(4):341-343. Acta Dermatovenerol Croat. 2018. PMID: 30665488
Cited by
- SPP1+ macrophages and FAP+ fibroblasts promote the progression of pMMR gastric cancer.
Su Z, He Y, You L, Chen J, Zhang G, Liu Z. Su Z, et al. Sci Rep. 2024 Oct 31;14(1):26221. doi: 10.1038/s41598-024-76298-w. Sci Rep. 2024. PMID: 39482333 Free PMC article. - Playing cancer at its own game: activating mitogenic signaling as a paradoxical intervention.
Dias MH, Bernards R. Dias MH, et al. Mol Oncol. 2021 Aug;15(8):1975-1985. doi: 10.1002/1878-0261.12979. Epub 2021 May 26. Mol Oncol. 2021. PMID: 33955157 Free PMC article. Review. - Targeting Genome Stability in Melanoma-A New Approach to an Old Field.
Osrodek M, Wozniak M. Osrodek M, et al. Int J Mol Sci. 2021 Mar 28;22(7):3485. doi: 10.3390/ijms22073485. Int J Mol Sci. 2021. PMID: 33800547 Free PMC article. Review. - Molecular subtypes and the evolution of treatment management in metastatic colorectal cancer.
Martini G, Dienstmann R, Ros J, Baraibar I, Cuadra-Urteaga JL, Salva F, Ciardiello D, Mulet N, Argiles G, Tabernero J, Elez E. Martini G, et al. Ther Adv Med Oncol. 2020 Jul 24;12:1758835920936089. doi: 10.1177/1758835920936089. eCollection 2020. Ther Adv Med Oncol. 2020. PMID: 32782486 Free PMC article. Review. - Mapping the genetic landscape establishing a tumor immune microenvironment favorable for anti-PD-1 response in mice and humans.
Skelly DA, Graham JP, Cheng M, Furuta M, Walter A, Stoklasek TA, Yang H, Stearns TM, Poirion O, Zhang JG, Grassmann JDS, Luo D, Flynn WF, Courtois ET, Chang CH, Serreze DV, Menghi F, Reinholdt LG, Liu ET. Skelly DA, et al. bioRxiv [Preprint]. 2024 Jul 16:2024.07.11.603136. doi: 10.1101/2024.07.11.603136. bioRxiv. 2024. PMID: 39071392 Free PMC article. Updated. Preprint.
References
Publication types
MeSH terms
Substances
Grants and funding
- T32 CA160001/CA/NCI NIH HHS/United States
- R01 CA205426/CA/NCI NIH HHS/United States
- K08 DE024774/DE/NIDCR NIH HHS/United States
- R35 CA232097/CA/NCI NIH HHS/United States
- P30 CA008748/CA/NCI NIH HHS/United States
- T32 CA009685/CA/NCI NIH HHS/United States
LinkOut - more resources
Full Text Sources
Other Literature Sources


