SIRT1 in Astrocytes Regulates Glucose Metabolism and Reproductive Function - PubMed (original) (raw)
SIRT1 in Astrocytes Regulates Glucose Metabolism and Reproductive Function
Irene Choi et al. Endocrinology. 2019.
Abstract
Sirtuin 1 (Sirt1) is an NAD-dependent class III deacetylase that functions as a cellular energy sensor. In addition to its well-characterized effects in peripheral tissues, evidence suggests that SIRT1 in neurons plays a role in the central regulation of energy balance and reproduction, but no studies have addressed the contribution of astrocytes. We show here that overexpression of SIRT1 in astrocytes causes markedly increased food intake, body weight gain, and glucose intolerance, but expression of a deacetylase-deficient SIRT1 mutant decreases food intake and body weight and improves glucose tolerance, particularly in female mice. Paradoxically, the effect of these SIRT1 mutants on insulin tolerance was reversed, with overexpression showing greater insulin sensitivity. The mice overexpressing SIRT1 were more active, generated more heat, and had elevated oxygen consumption, possibly in compensation for the increased food intake. The female overexpressing mice were also more sensitive to diet-induced obesity. Reproductively, the mice expressing the deacetylase-deficient SIRT1 mutant had impaired estrous cycles, decreased LH surges, and fewer corpora lutea, indicating decreased ovulation. The GnRH neurons were responsive to kisspeptin stimulation, but hypothalamic expression of Kiss1 was reduced in the mutant mice. Our results showed that SIRT1 signaling in astrocytes can contribute to metabolic and reproductive regulation independent of SIRT1 effects in neurons.
Copyright © 2019 Endocrine Society.
Figures
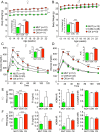
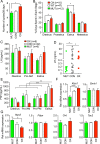
Figure 1.
Overexpression of SIRT1 in astrocytes causes weight gain and glucose intolerance. (A) Body weights of female mice after TAM induction up to 22 weeks of age. OX mice are in red, CON mice in white, and MUT mice in green (n = 11, 48, and 12, respectively). Repeated-measures two-way ANOVA indicated a significant time effect (P = 0.016) and a significant genotype effect (P < 0.0001). Inset shows average daily food intake. (B) Body weights and average food intake for male mice up to 22 weeks of age (n = 10 for OX, n = 46 for CON, and n = 13 for MUT). Repeated-measures two-way ANOVA indicated a significant time effect (P = 0.002) and a significant genotype effect (P < 0.0001) for body weight. (C) GTTs performed in female mice at 3 months of age (n = 11 for OX, n = 45 for CON, and n = 10 for MUT). Repeated-measures two-way ANOVA indicated significant genotype and time effects and interaction (P < 0.0001). Inset shows area under the curve (AUC). (D) GTTs performed in male mice at 3 months of age (n = 10 for OX, n = 41 for CON, and n = 12 for MUT). Repeated-measures two-way ANOVA indicated significant genotype and time effects and interaction (P < 0.0001). Inset shows AUC. (E) FBG, FI, HOMA-IR, and C-peptide levels for 6-hour fasted female mice (n = 21 for OX, n = 22 for CON, n = 19 for MUT). (F) FBG, FI, HOMA-IR, and C-peptide levels for 6-hour fasted male mice. Results are presented as mean ± SEM. Asterisks indicate significance from post hoc testing. *P < 0.05; **P < 0.01; ***P < 0.001; ****P < 0.0001.
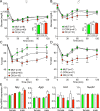
Figure 2.
Overexpression of SIRT1 in astrocytes increases insulin sensitivity. (A) ITTs performed in female mice at 3 months of age (n = 9 for OX, n = 36 for CON, n = 9 for MUT). OX mice are in red, CON mice in white, and MUT mice in green. Repeated-measures two-way ANOVA indicated significant time effect and time-genotype interaction (P < 0.0001) but no genotype effect. Inset shows area above the curve (AAC). (B) ITTs performed in male mice at 3 months of age (n = 7 for OX, n = 39 for CON, n = 9 for MUT). Repeated-measures two-way ANOVA indicated significant time effect and genotype-time interaction (P < 0.001 and P < 0.0001) but no genotype effect. Inset shows AAC. (C) ITTs in female mice presented as percentage basal fasting glucose level. Repeated-measures two-way ANOVA indicated significant time effect and genotype effects (P < 0.0001) and interaction (P < 0.001). (D) ITTs in male mice presented as percentage basal fasting glucose level. Repeated-measures two-way ANOVA indicated significant time effect and genotype effects (P < 0.0001 and P < 0.01) and interaction (P < 0.001). (E) Hypothalamic orexigenic gene expression for neuropeptide Y (Npy), agouti-related peptide (Agrp), orexin-A (Hcrt), and nesfatin (Nucb2) in MUT, CON, and OX mice. Gene expression from female mice (n = 8 for MUT, n = 27 for CON, and n = 6 for OX) and male mice (n = 7 for MUT, n = 28 for CON, and n = 7 for OX) by qPCR. Results are presented as mean ± SEM. Asterisks indicate significance from post hoc testing. *P < 0.05; **P < 0.01; ***P < 0.001.
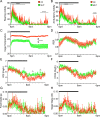
Figure 3.
Metabolic cage studies of female OX and MUT mice. OX mice (n = 6) are shown in red and MUT mice (n = 6) in green. Graphs show diurnal patterns over 24 hours measured per minute for physical activity or per 13-minute interval for other measurements. Horizontal black bar indicates period of lights off (6:00
pm
to 6:00
am
). Time of day is indicated on the _x_-axis. (A) Rearing activity over 24 hours. Repeated-measures two-way ANOVA indicated significant genotype and time effects (P < 0.0001) and interaction (P < 0.0001). (B) Ambulatory activity over 24 hours. Repeated-measures two-way ANOVA indicated significant genotype and time effects (P < 0.0001) and interaction (P < 0.0001). (C) Cage temperature over 24 hours. Repeated-measures two-way ANOVA indicated significant genotype and time effects (P < 0.0001) and interaction (P < 0.0001). (D) RER over 24 hours. Repeated-measures two-way ANOVA indicated significant time effect (P < 0.0001) and a significant interaction (P < 0.0001) but no genotype effect. (E) Volume O2 consumed (VO2) over 24 hours. Repeated-measures two-way ANOVA indicated significant time (P < 0.0001) and genotype (P < 0.01) effects and a significant interaction (P < 0.0001). (F) Volume CO2 produced (VCO2) over 24 hours. Repeated-measures two-way ANOVA indicated significant genotype (P < 0.05) and time effects (P < 0.0001) and interaction (P < 0.01) but no post hoc significant differences between genotypes. (G) Food intake over 24 hours. Repeated-measures two-way ANOVA indicated significant time effect (P < 0.0001) but no genotype effect or interaction. (H) Water intake over 24 hours. Repeated-measures two-way ANOVA indicated significant genotype and time effect (P < 0.0001), no genotype effect, but a significant interaction (P < 0.01). Results are presented as mean ± SEM. Asterisks indicate significant differences between genotypes after post hoc testing. *P < 0.05; ****P < 0.0001.
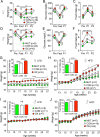
Figure 4.
Overexpression of SIRT1 does not alter the response to fasting but increases weight gain in females on an HFD. OX mice are in red, CON mice in white, and MUT mice in green. (A) Body weight for female mice before, during, and after a 24-hour fast (n = 10 for OX, n = 16 for CON, n = 10 for MUT). (B) Blood glucose before, during, and after a 24-hour fast. (C) Food intake before and for 2 days after a 24-hour fast. (D) Body weight for male mice before, during, and after a 24-hour fast (n = 10 for OX, n = 16 for CON, n = 10 for MUT). (E) Blood glucose before, during, and after a 24-hour fast. (F) Food intake before and for 2 days after a 24-hour fast. Repeated-measures two-way ANOVA indicated significant time and genotype effects (P < 0.0001) for weight and blood glucose and a significant time effect (P < 0.0001) and genotype effect (P < 0.05) for food intake for both female and male mice. (G) Body weight of female mice on an LFD for 10 weeks (n = 5 for OX, n = 10 for CON, n = 5 for MUT). Repeated-measures two-way ANOVA indicated significant time and genotype (P < 0.001) effects. Inset shows mean daily food intake. (H) Body weight of female mice on an HFD for 10 weeks (n = 7 for OX, n = 12 for CON, n = 7 for MUT). Repeated-measures two-way ANOVA indicated significant time effect and genotype-time interaction (P < 0.0001). Inset shows mean daily food intake. (I) Body weight of male mice on an LFD for 10 weeks (n = 7 for OX, n = 11 for CON, n = 5 for MUT). Inset shows mean daily food intake. (J) Body weight of male mice on an HFD for 10 weeks (n = 6 for OX, n = 10 for CON, n = 5 for MUT). Repeated-measures two-way ANOVA indicated no significant time and genotype effects for weight on LFD or HFD for male mice. Inset shows mean daily food intake. Data are shown as mean ± SEM. Asterisks indicate significance by post hoc testing as indicated. *P < 0.05; **P < 0.01; ***P < 0.001; ****P < 0.0001.
Figure 5.
Overexpression of SIRT1 increases estrous cycling and ovulation in female mice. OX mice are in red, CON mice in white, and MUT mice in green. (A) Number of estrous cycles over 28 days of cycling by vaginal cytology (n = 10 for OX, n = 47 for CON, n = 12 for MUT). (B) Percentage of days spent in each stage of the estrous cycle over 28 days (n = 10 for OX, n = 47 for CON, n = 12 for MUT). Two-way ANOVA indicated significant stage effect (P < 0.0001) and significant interaction of stage and genotype (P < 0.0001). (C) LH levels during diestrus, the morning of proestrus, and the morning of estrus (n = 6 for OX, n = 20 for CON, n = 8 for MUT). Two-way ANOVA indicated no significant differences. (D) LH levels during the afternoon of proestrus (n = 6 for OX, n = 20 for CON, n = 8 for MUT). Asterisks indicate a significant difference in the number of LH surges by Fisher exact test. (E) FSH levels during diestrus, the morning of proestrus, the afternoon of proestrus, and the morning of estrus (n = 6 for OX, n = 20 for CON, n = 8 for MUT). Two-way ANOVA indicates significant stage effect (P = 0.002) but no significant genotype effect or interaction. (F) Hypothalamic Kiss1 and Gnrh1 expression in MUT, CON, and OX mice by qPCR. (G) Hypothalamic neuropeptide gene expression for MUT, CON, and OX mice by qPCR. n = 8 for MUT. n = 27 for COM, n = 6 for OX for qPCR data. Results are presented as mean ± SEM. Asterisks indicate significance from post hoc testing as indicated. *P < 0.05; **P < 0.01; ***P < 0.001; ****P < 0.0001.
Figure 6.
SIRT1 inactivation reduces ovary size and number of corpora lutea. OX mice are in red, CON mice in white, and MUT mice in green. (A) Ovarian morphology. Representative hematoxylin and eosin stained sections of ovaries obtained at euthanasia. (B) Quantification of ovarian cross-sectional area for MUT (n = 9), CON (n = 35), and OX (n = 9) ovaries. (C) Quantification of follicle stage and corpora lutea. Number of follicles at each stage per section for MUT (n = 9), CON (n = 9), and OX (n = 9) mice. (D) Estrogen and progesterone levels during diestrus, proestrus, and estrus. Data are shown as mean ± SEM. Asterisks indicate significance by post hoc testing. *P < 0.05; **P < 0.01; ***P < 0.001. AF, antral follicle; CL, corpora lutea.
Similar articles
- Hypothalamic SIRT1 prevents age-associated weight gain by improving leptin sensitivity in mice.
Sasaki T, Kikuchi O, Shimpuku M, Susanti VY, Yokota-Hashimoto H, Taguchi R, Shibusawa N, Sato T, Tang L, Amano K, Kitazumi T, Kuroko M, Fujita Y, Maruyama J, Lee YS, Kobayashi M, Nakagawa T, Minokoshi Y, Harada A, Yamada M, Kitamura T. Sasaki T, et al. Diabetologia. 2014 Apr;57(4):819-31. doi: 10.1007/s00125-013-3140-5. Epub 2013 Dec 29. Diabetologia. 2014. PMID: 24374551 Free PMC article. - Neuronal Sirt1 deficiency increases insulin sensitivity in both brain and peripheral tissues.
Lu M, Sarruf DA, Li P, Osborn O, Sanchez-Alavez M, Talukdar S, Chen A, Bandyopadhyay G, Xu J, Morinaga H, Dines K, Watkins S, Kaiyala K, Schwartz MW, Olefsky JM. Lu M, et al. J Biol Chem. 2013 Apr 12;288(15):10722-35. doi: 10.1074/jbc.M112.443606. Epub 2013 Mar 1. J Biol Chem. 2013. PMID: 23457303 Free PMC article. - MCH Regulates SIRT1/FoxO1 and Reduces POMC Neuronal Activity to Induce Hyperphagia, Adiposity, and Glucose Intolerance.
Al-Massadi O, Quiñones M, Clasadonte J, Hernandez-Bautista R, Romero-Picó A, Folgueira C, Morgan DA, Kalló I, Heras V, Senra A, Funderburk SC, Krashes MJ, Souto Y, Fidalgo M, Luquet S, Chee MJ, Imbernon M, Beiroa D, García-Caballero L, Gallego R, Lam BYH, Yeo G, Lopez M, Liposits Z, Rahmouni K, Prevot V, Dieguez C, Nogueiras R. Al-Massadi O, et al. Diabetes. 2019 Dec;68(12):2210-2222. doi: 10.2337/db19-0029. Epub 2019 Sep 16. Diabetes. 2019. PMID: 31530579 Free PMC article. - Roles of FoxO1 and Sirt1 in the central regulation of food intake.
Sasaki T, Kitamura T. Sasaki T, et al. Endocr J. 2010;57(11):939-46. doi: 10.1507/endocrj.k10e-320. Epub 2010 Oct 30. Endocr J. 2010. PMID: 21048357 Review. - Age-Associated Weight Gain, Leptin, and SIRT1: A Possible Role for Hypothalamic SIRT1 in the Prevention of Weight Gain and Aging through Modulation of Leptin Sensitivity.
Sasaki T. Sasaki T. Front Endocrinol (Lausanne). 2015 Jul 16;6:109. doi: 10.3389/fendo.2015.00109. eCollection 2015. Front Endocrinol (Lausanne). 2015. PMID: 26236282 Free PMC article. Review.
Cited by
- Substrate-Dependent Sensitivity of SIRT1 to Nicotinamide Inhibition.
Rymarchyk S, Kang W, Cen Y. Rymarchyk S, et al. Biomolecules. 2021 Feb 18;11(2):312. doi: 10.3390/biom11020312. Biomolecules. 2021. PMID: 33670751 Free PMC article. - Shared Pathophysiological Mechanisms and Genetic Factors in Early Menarche and Polycystic Ovary Syndrome.
Tinano FR, Machado IFR, Latronico AC, Gomes LG. Tinano FR, et al. J Neurosci. 2025 Mar 12;45(11):e1681242024. doi: 10.1523/JNEUROSCI.1681-24.2024. J Neurosci. 2025. PMID: 40074331 Review. - Sirt1 Activity in the Brain: Simultaneous Effects on Energy Homeostasis and Reproduction.
D'Angelo S, Mele E, Di Filippo F, Viggiano A, Meccariello R. D'Angelo S, et al. Int J Environ Res Public Health. 2021 Jan 30;18(3):1243. doi: 10.3390/ijerph18031243. Int J Environ Res Public Health. 2021. PMID: 33573212 Free PMC article. Review. - The Versatility of Sirtuin-1 in Endocrinology and Immunology.
Rasha F, Mims BM, Castro-Piedras I, Barnes BJ, Grisham MB, Rahman RL, Pruitt K. Rasha F, et al. Front Cell Dev Biol. 2020 Nov 19;8:589016. doi: 10.3389/fcell.2020.589016. eCollection 2020. Front Cell Dev Biol. 2020. PMID: 33330467 Free PMC article. Review. - Sirtuin (SIRT)-1: At the crossroads of puberty and metabolism.
Aylwin CF, Lomniczi A. Aylwin CF, et al. Curr Opin Endocr Metab Res. 2020 Oct;14:65-72. doi: 10.1016/j.coemr.2020.06.001. Epub 2020 Jun 12. Curr Opin Endocr Metab Res. 2020. PMID: 32905232 Free PMC article.
References
Publication types
MeSH terms
Substances
Grants and funding
- T32 HD007203/HD/NICHD NIH HHS/United States
- P30 DK063491/DK/NIDDK NIH HHS/United States
- P30 CA023100/CA/NCI NIH HHS/United States
- U54 HD012303/HD/NICHD NIH HHS/United States
- I01 BX000130/BX/BLRD VA/United States
- U54 CA155435/CA/NCI NIH HHS/United States
- P50 HD012303/HD/NICHD NIH HHS/United States
- R01 CA196853/CA/NCI NIH HHS/United States
LinkOut - more resources
Full Text Sources
Molecular Biology Databases
