Human cGAS catalytic domain has an additional DNA-binding interface that enhances enzymatic activity and liquid-phase condensation - PubMed (original) (raw)
Human cGAS catalytic domain has an additional DNA-binding interface that enhances enzymatic activity and liquid-phase condensation
Wei Xie et al. Proc Natl Acad Sci U S A. 2019.
Abstract
The cyclic GMP-AMP synthase (cGAS)-cGAMP-STING pathway plays a key role in innate immunity, with cGAS sensing both pathogenic and mislocalized DNA in the cytoplasm. Human cGAS (h-cGAS) constitutes an important drug target for control of antiinflammatory responses that can contribute to the onset of autoimmune diseases. Recent studies have established that the positively charged N-terminal segment of cGAS contributes to enhancement of cGAS enzymatic activity as a result of DNA-induced liquid-phase condensation. We have identified an additional cGASCD-DNA interface (labeled site-C; CD, catalytic domain) in the crystal structure of a human SRY.cGASCD-DNA complex, with mutations along this basic site-C cGAS interface disrupting liquid-phase condensation, as monitored by cGAMP formation, gel shift, spin-down, and turbidity assays, as well as time-lapse imaging of liquid droplet formation. We expand on an earlier ladder model of cGAS dimers bound to a pair of parallel-aligned DNAs to propose a multivalent interaction-mediated cluster model to account for DNA-mediated condensation involving both the N-terminal domain of cGAS and the site-C cGAS-DNA interface. We also report the crystal structure of the h-cGASCD-DNA complex containing a triple mutant that disrupts the site-C interface, with this complex serving as a future platform for guiding cGAS inhibitor development at the DNA-bound h-cGAS level. Finally, we solved the structure of RU.521 bound in two alternate alignments to apo h-cGASCD, thereby occupying more of the catalytic pocket and providing insights into further optimization of active-site-binding inhibitors.
Keywords: DNA-binding cGAS mutations; h-cGAS–DNA complex; liquid-phase condensation; multivalent interactions.
Conflict of interest statement
The authors declare no conflict of interest.
Figures
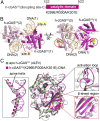
Fig. 1.
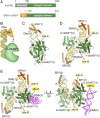
Identification of an additional protein–DNA interface in the crystal structure of the SRY.h-cGASCD–DNA complex. (A) Schematic drawing of human full-length (FL) cGAS protein, showing N-terminal domain in gray and catalytic domain (CD) in green, and a fusion SRY.h-cGASCD protein with the SRY domain in orange. Numbers above the sequence indicate the domain boundaries. (B) A schematic of the fusion SRY.h-cGASCD–DNA complex with the SRY domain binding to its sequence-specific DNA element and h-cGASCD binding nonsequence specifically to an adjacent DNA site. (C and D) Views of the monomeric (C) and dimeric (D) structure of the SRY.h-cGASCD–DNA complex. An individual h-cGASCD (1) interacts with DNA (1) (site-A) and DNA (2) (site-B) as reported previously for a dimeric complex (h-cGASCD in green and DNA in teal) (PDB ID code 4LEY). (E) Two views of the SRY.h-cGASCD–DNA complex highlighting an additional protein–DNA interface (site-C) involving recognition by cGASCD (1) of DNA (3) in magenta.
Fig. 2.
Site-C DNA interaction interface of cGAS is evolutionarily strengthened. (A) Two views of the basic cGASCD site-C DNA interface in the structure of the SRY.h-cGASCD–DNA complex, with the protein shown in an electrostatic representation and DNA colored in magenta. (B and C) The basic cGASCD site-C DNA interface in the structures of cGASCD–DNA complexes from porcine (B) (PDB ID code 4KB6) and mouse (C) (PDB ID code 4LEY), with the protein shown in an electrostatic representation and DNA colored in magenta. Electrostatic surface potentials were calculated in PyMol and contoured at ±100 (D) Sequence alignment of cGAS residues on the site-C interface from Homo sapiens (human; Uniprot Q8N884), Macaca mulatta (monkey; Uniprot A0A1D5QFG4), Sus scrofa (porcine; Uniprot I3LM39), Mus musculus (mouse; Uniprot Q8C6L5), and Rattus norvegicus (rat; Uniprot A0A0G2JVC4). Numbering above the sequences corresponds to that for h-cGAS. Black and orange triangles denote residues that interact with DNA at site-C partitioned into α-region, KRKR-loop and KKH-loop segments, with orange triangles in addition denoting tumor-associated mutation sites G303E and K432T. The alignment was visualized with ENDscript server.
Fig. 3.
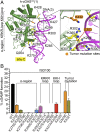
Details of h-cGASCD site-C DNA interaction interface and impact of site-C mutations on cGAMP formation. (A) Structural details of site-C interface of h-cGASCD (1) (green) bound to DNA (3) (magenta) in the SRY.h-cGASCD–DNA complex. Residues involved in intermolecular contacts are shown in yellow stick representation and partitioned between α-region, KRKR-loop and KKH-loop segments. The tumor-associated site-C mutations (G303E and K432T) are colored orange in the expanded panel. (B) Impact of site-C mutations on cGAMP production detected by RF-MS assay using FL h-cGAS and 100-bp DNA. Each reaction contains 25 nM DNA, 100 nM FL h-cGAS proteins, 100 µM ATP/GTP, incubated at 37 °C for 3 h. Data are represented as means ± SD of three independent experiments. The data are partitioned by α-region, KRKR-loop, KKH-loop, and tumor (K432T and G303E) mutations on cGAMP production.
Fig. 4.
Impact of the site-C interface mutations on DNA-binding property as monitored by EMSA. (A) Comparison of binding properties of WT (Left) and R300E/K301E KRKR-loop mutant (Right) of FL h-cGAS with DNA. (B) Comparison of binding properties of K279E/K282E α-region mutant (Left) and K427E/K428E KKH-loop mutant (Right) of FL h-cGAS with DNA. (C) Comparison of binding properties of R301E/K301E KRKR-loop and K427E/K428E KKH-loop mutants of FL h-cGAS (Left) and WT FL m-cGAS (Right) with DNA. (D) Comparison of binding properties of G300E (Left) and K432T (Right) FL h-cGAS tumor mutants with DNA. Each reaction contains 1 pmol of Cy3-ISD45 DNA. cGAS proteins were added at 2-fold increment from 1 to 32 pmol. The corresponding molar ratio of cGAS to DNA is shown at the top of the gel. The positions of DNA-cGAS condensate, the lower-order forms of DNA–cGAS complex(es), and free Cy3-ISD45 45-bp DNA are indicated on the right side of the 6% DNA retardation Gels. Data are representative of at least two independent experiments.
Fig. 5.
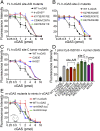
The site-C interface promotes the DNA condensation ability of cGAS as monitored by a spin-down assay. (A–C) DNA condensation assays of Cy3-ISD100 with FL WT and mutant h-cGAS proteins. Twofold increasing concentrations of h-cGAS proteins (from 0.25 to 16 pmol) were mixed with 1 pmol of ISD100 for 1 h at room temperature. After centrifugation to remove the cGAS–DNA condensate, the fluorescence intensity values of Cy3 in the supernatant were plotted against cGAS protein concentrations. (D) Quantification of 4-pmol h-cGAS proteins to 1-pmol DNA condensation experiments in A, B, and C. (E) FL m-cGAS mutants to mimic h-cGAS show enhanced DNA condensation ability.
Fig. 6.
The site-C interface promotes the liquid-phase condensation ability of cGAS as monitored by turbidity. Quantitative turbidity graphs data on (A) FL h-cGAS and h-cGASCD, (B) site-A/B mutants of FL h-cGAS, (C) site-C mutants of FL h-cGAS, and (D) site-C tumor mutants of FL h-cGAS. Data are represented as means ± SD of three independent experiments.
Fig. 7.
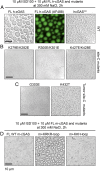
Site-C DNA binding surface of cGAS is essential for DNA-induced liquid-phase condensation as identified from time-lapse imaging of liquid droplet formation. (A) Bright-field and GFP imaging of liquid droplet formation for FL h-cGAS and h-cGASCD complexes. (B) Bright-field imaging of liquid droplet formation for FL site-C h-cGAS K279E/K282E, R300E/K301E, and K427E/K428E mutant complexes. (C) Bright-field imaging of liquid droplet formation for FL site-C h-cGAS G303E and K432T tumor mutant complexes. (D) Bright-field imaging of liquid droplet formation for WT FL m-cGAS and swaps containing the human-specific KRKR loop and human KKH loop inserted into m-cGAS. The images shown are representative of all fields in the well. Data are representative of at least two independent experiments. FL h-cGAS mutants are indicated on the top of the panels. (Scale bar, 10 µm.)
Fig. 8.
Crystal structure of h-cGASCD (K299E/R300A/K301E) bound to DNA and comparison with apo h-cGASCD structure. (A) Schematic showing positioning of K299E/R300A/K301E triple mutant within h-cGASCD. (B) Side and top views of dimeric structure of h-cGASCD (K299E/R300A/K301E) bound to 16-bp DNA (containing 1-nt overhang). h-cGASCD monomers are colored in magenta and pink, while the pair of bound DNAs are colored in teal, with labeling of sites-A and site-B. The triple mutation sites are shown in a space-filling representation and indicated by red circles. (C) Superposed structures of apo h-cGASCD (PDB ID code 4LEV; in green) and DNA-bound h-cGASCD (K299E/R300A/K301E) (this study; in magenta). The structures of the two complexes exhibit an rmsd of 0.637 Å. The blow-up views compare conformational changes of the α-helix spine (Left), activation loop (Upper Right), and β-sheet segments (Lower Right). The black arrows indicate the small shift in β-strands on proceeding from apo- to DNA-bound states for m-cGASCD.
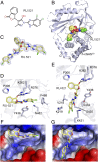
Fig. 9.
Structure of RU.521 bound to apo h-cGASCD. (A) Chemical formula of RU.521. (B) Crystal structure of RU.521 bound to apo h-cGASCD(K427E/K428E). The bound RU.521 positioned in the catalytic pocket in two orientations is shown in a space-filling representation. (C) 2Fo-Fc electron density map of RU.521 bound in two orientations contoured at 1.2σ level. (D and E) Pairing alignments of bound RU.521 in one orientation where the planar benzimidazole-pyrazole rings are intercalated between the side chains of Arg-376 and Tyr-436 (D) and a second orientation where the planar benzimidazole-pyrazole rings is positioned in a channel at the bottom of the catalytic pocket (E). (F and G) Pairing alignments of bound RU.521 in two orientations in the catalytic pocket of apo h-cGASCD, with the protein shown in an electrostatic representation and RU.521 colored in yellow stick representation. Electrostatic surface potentials were calculated in PyMol and contoured at ±100.
Fig. 10.
Proposed cluster model of long DNA sensed by h-cGAS. Apo cGAS proteins can exist as dimers in solution, capable of forming a dimeric cGAS–DNA complex composed of a pair of cGAS dimers bound to a pair of DNAs (structure labeled 1). Binding of an additional pair of cGAS dimers results in formation of structure labeled 2 (PDB ID code 5N6I), eventually resulting in the formation of a ladder-like model of complex formation with longer DNA (schematic labeled 3). The availability of site-C interfaces results in increased multivalency generating the proposed cluster model shown in schematics labeled 4, 5, and 6, reflecting formation of higher-order DNA complexes contributing to DNA binding affinity. Such a net-like structure shown in schematic labeled 7 can contribute to DNA condensation and phase separation.
Similar articles
- The catalytic mechanism of cyclic GMP-AMP synthase (cGAS) and implications for innate immunity and inhibition.
Hall J, Ralph EC, Shanker S, Wang H, Byrnes LJ, Horst R, Wong J, Brault A, Dumlao D, Smith JF, Dakin LA, Schmitt DC, Trujillo J, Vincent F, Griffor M, Aulabaugh AE. Hall J, et al. Protein Sci. 2017 Dec;26(12):2367-2380. doi: 10.1002/pro.3304. Epub 2017 Oct 25. Protein Sci. 2017. PMID: 28940468 Free PMC article. - Ku proteins promote DNA binding and condensation of cyclic GMP-AMP synthase.
Tao X, Song J, Song Y, Zhang Y, Yang J, Zhang P, Zhang D, Chen D, Sun Q. Tao X, et al. Cell Rep. 2022 Sep 6;40(10):111310. doi: 10.1016/j.celrep.2022.111310. Cell Rep. 2022. PMID: 36070696 - DNA-induced liquid phase condensation of cGAS activates innate immune signaling.
Du M, Chen ZJ. Du M, et al. Science. 2018 Aug 17;361(6403):704-709. doi: 10.1126/science.aat1022. Epub 2018 Jul 5. Science. 2018. PMID: 29976794 Free PMC article. - Molecular mechanisms and cellular functions of cGAS-STING signalling.
Hopfner KP, Hornung V. Hopfner KP, et al. Nat Rev Mol Cell Biol. 2020 Sep;21(9):501-521. doi: 10.1038/s41580-020-0244-x. Epub 2020 May 18. Nat Rev Mol Cell Biol. 2020. PMID: 32424334 Review. - [Cytosolic DNA sensing by the cGAS-STING pathway in cancer].
Chanut R, Petrilli V. Chanut R, et al. Med Sci (Paris). 2019 Jun-Jul;35(6-7):527-534. doi: 10.1051/medsci/2019095. Epub 2019 Jul 5. Med Sci (Paris). 2019. PMID: 31274082 Review. French.
Cited by
- Phase separation in immune signalling.
Xiao Q, McAtee CK, Su X. Xiao Q, et al. Nat Rev Immunol. 2022 Mar;22(3):188-199. doi: 10.1038/s41577-021-00572-5. Epub 2021 Jul 6. Nat Rev Immunol. 2022. PMID: 34230650 Free PMC article. Review. - Enzymatic activity of cGAS in the presence of three types of DNAs: limited cGAS stimulation by single-stranded HIV-1 SL2 DNA.
Mizuguchi M, Kyan N, Nishimata S, Nabeshima Y, Obita T. Mizuguchi M, et al. Biosci Rep. 2024 Apr 24;44(4):BSR20240269. doi: 10.1042/BSR20240269. Biosci Rep. 2024. PMID: 38530250 Free PMC article. - Control of innate immunity by the cGAS-STING pathway.
Mosallanejad K, Kagan JC. Mosallanejad K, et al. Immunol Cell Biol. 2022 Jul;100(6):409-423. doi: 10.1111/imcb.12555. Epub 2022 May 25. Immunol Cell Biol. 2022. PMID: 35485309 Free PMC article. Review. - Chloride Homeostasis Regulates cGAS-STING Signaling.
Morse J, Wang D, Mei S, Whitham D, Hladun C, Darie CC, Sintim HO, Wang M, Leung K. Morse J, et al. bioRxiv [Preprint]. 2024 Apr 9:2024.04.08.588475. doi: 10.1101/2024.04.08.588475. bioRxiv. 2024. PMID: 38645072 Free PMC article. Preprint. - cGAS-STING: insight on the evolution of a primordial antiviral signaling cassette.
Cai H, Imler JL. Cai H, et al. Fac Rev. 2021 Jun 8;10:54. doi: 10.12703/r/10-54. eCollection 2021. Fac Rev. 2021. PMID: 34195693 Free PMC article. Review.
References
Publication types
MeSH terms
Substances
LinkOut - more resources
Full Text Sources
Molecular Biology Databases
Research Materials
