METTL3 facilitates tumor progression via an m6A-IGF2BP2-dependent mechanism in colorectal carcinoma - PubMed (original) (raw)
doi: 10.1186/s12943-019-1038-7.
Pei-Shan Hu 1, Zhixiang Zuo 1, Jin-Fei Lin 1 2, Xingyang Li 1, Qi-Nian Wu 1 3, Zhan-Hong Chen 1 4, Zhao-Lei Zeng 1, Feng Wang 1 2, Jian Zheng 1, Demeng Chen 5, Bo Li 6, Tie-Bang Kang 1, Dan Xie 1 3, Dongxin Lin 1 7, Huai-Qiang Ju 8, Rui-Hua Xu 9 10
Affiliations
- PMID: 31230592
- PMCID: PMC6589893
- DOI: 10.1186/s12943-019-1038-7
METTL3 facilitates tumor progression via an m6A-IGF2BP2-dependent mechanism in colorectal carcinoma
Ting Li et al. Mol Cancer. 2019.
Abstract
Background: Colorectal carcinoma (CRC) is one of the most common malignant tumors, and its main cause of death is tumor metastasis. RNA N6-methyladenosine (m6A) is an emerging regulatory mechanism for gene expression and methyltransferase-like 3 (METTL3) participates in tumor progression in several cancer types. However, its role in CRC remains unexplored.
Methods: Western blot, quantitative real-time PCR (RT-qPCR) and immunohistochemical (IHC) were used to detect METTL3 expression in cell lines and patient tissues. Methylated RNA immunoprecipitation sequencing (MeRIP-seq) and transcriptomic RNA sequencing (RNA-seq) were used to screen the target genes of METTL3. The biological functions of METTL3 were investigated in vitro and in vivo. RNA pull-down and RNA immunoprecipitation assays were conducted to explore the specific binding of target genes. RNA stability assay was used to detect the half-lives of the downstream genes of METTL3.
Results: Using TCGA database, higher METTL3 expression was found in CRC metastatic tissues and was associated with a poor prognosis. MeRIP-seq revealed that SRY (sex determining region Y)-box 2 (SOX2) was the downstream gene of METTL3. METTL3 knockdown in CRC cells drastically inhibited cell self-renewal, stem cell frequency and migration in vitro and suppressed CRC tumorigenesis and metastasis in both cell-based models and PDX models. Mechanistically, methylated SOX2 transcripts, specifically the coding sequence (CDS) regions, were subsequently recognized by the specific m6A "reader", insulin-like growth factor 2 mRNA binding protein 2 (IGF2BP2), to prevent SOX2 mRNA degradation. Further, SOX2 expression positively correlated with METTL3 and IGF2BP2 in CRC tissues. The combined IHC panel, including "writer", "reader", and "target", exhibited a better prognostic value for CRC patients than any of these components individually.
Conclusions: Overall, our study revealed that METTL3, acting as an oncogene, maintained SOX2 expression through an m6A-IGF2BP2-dependent mechanism in CRC cells, and indicated a potential biomarker panel for prognostic prediction in CRC.
Keywords: Colorectal cancer; IGF2BP2; METTL3; N6-methyladenosine (m6A); SOX2.
Conflict of interest statement
The authors declare that they have no competing interests.
Figures
Fig. 1
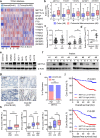
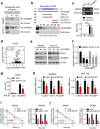
METTL3 is highly expressed in metastatic CRC and associated with poor prognosis. a Heat map profiling the expression of m6A WERs in the TCGA database of COAD. b Real-time PCR analysis of m6A WER expression in 48 paired CRC tumor tissues (T) and adjacent normal tissues (N). c Real-time PCR analysis of METTL3 expression in CRC tissues from patients with recurrence (R, n = 48) and without recurrence (T, n = 48), 28 paired liver metastatic tissues (LM) versus primary tumor tissues (T), and adjacent normal tissues (N). d-e Real-time PCR analysis and Immunoblotting assay of METTL3 expression in normal colonic epithelial cell lines and CRC cell lines. f Immunoblotting assay of METTL3 expression in eight paired CRC primary tumor samples (T) and adjacent normal tissues (N). g Representative images showing METTL3 expression in CRC adjacent normal tissues (ANT) (upper) versus high METTL3 expression in CRC tumor tissues (T) (lower) (scale bar: 100 μm). h METTL3 IHC staining scores in CRC tumor tissues versus ANT (n = 432), paired lymph node metastatic tissues (LNM, n = 52) or paired liver metastatic tissues (LM, n = 43). i Correlation between METTL3 expression with CRC patient response to FOLFOX or XELOX chemotherapy. The data were analyzed by Pearson’s _Chi-_square test. j Kaplan-Meier analysis of OS time (upper) and DFS time (lower) based on METTL3 expression. CR, complete response; PR, partial response; SD, stable disease; PD, progressive disease. The data in b, c, d, and i, are presented as the mean ± SDs (n = 3). *P < 0.05, **P < 0.01 (Student’s _t_-test). β-Actin was used as the loading control
Fig. 2
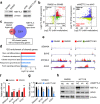
Identification of METTL3 targets via MeRIP-seq and RNA-seq. a, Immunoblotting of METTL3 in SW480 and SW620 cells (left), and in METTL3 knockdown SW620 and control SW620 cells (right). b, Distribution of peaks (fold change > 1.5 or < − 1.5, P < 0.05) with a significant change in both the RNA expression level and m6A level in SW620 cells compared with SW480 cells (left), and in METTL3 knockdown SW620 cells compared to control SW620 cells (right). c, Venn diagram showing the shared peaks between metastatic-related hyper-up peaks and METTL3-related hypo-down peaks. A total of 192 shared peaks corresponding to 158 specific genes were observed. d, GO biological process enrichment analysis of the above shared peaks. e, The m6A abundances in SEMA3A, BCHE, ZFP36L2, and SOX2 transcripts in SW620 cells related to the SW480 cells (left panel), and in METTL3-knockdown SW620 cells (shMETTL3#1) related to the control SW620 cells (shNC) (right panel). f, Gene-specific m6A qPCR analysis of alterations in the m6A level in four representative genes in SW620 and SW480 cells. g, Gene-specific m6A qPCR analysis of alterations in the m6A level in four representative genes in METTL3-knockdown SW620 and control SW620 cells. h, Immunoblotting assay of SOX2 after METTL3-knockdown in SW620 and HCT116 cells. The data in f, and g are presented as the mean ± SDs (n = 3). *P < 0.05, **P < 0.01 (Student’s _t_-test). β-Actin was used as the loading control. The relative m6A level was normalized by input. The relative expression level was normalized by the β-Actin
Fig. 3
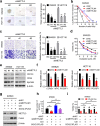
METTL3 promotes CRC cell stemness in vitro. a, Representative images and quantification of the in vitro sphere-formation assay of METTL3 knockdown CRC cells and control cells (n = 6). Scale bar: 200 μm. b, In vitro limiting dilution assay of METTL3 knockdown and control SW620 cells. A well not containing spheres (diameter ≥ 50 μm) was defined as a non-response (n = 12). c, Representative images and quantification of invaded METTL3-knockdown and control SW620 and HCT116 cells. Scale bar: 100 μm. d, Cell viability of METTL3-knockdown SW620 cells and control SW620 cells after treatment with oxaliplatin for 48 h. e, Immunoblotting analysis of stem-like cell surface antigen (CD133, CD44, and EpCAM) in METTL3-knockdown and control SW620 and HCT116 cells. f, Real-time PCR analysis of SOX2 targets genes (CCND1, MYC, and POU5F1) in METTL3-knockdown and control SW620 and HCT116 cells. g, Immunoblotting analysis of SOX2 and METTL3 in METTL3-knockdown and control SW620 cells with or without SOX2 overexpression. h, Quantification of the in vitro sphere-formation assay of METTL3 knockdown and control SW620 cells with or without SOX2 overexpression. (n = 6). i, Cell viability of METTL3-knockdown and control SW620 cells with or without SOX2 overexpression after oxaliplatin treatment for 48 h. All data are presented as the mean ± SDs (n = 3). *P < 0.05, **P < 0.01 (Student’s _t_-test). β-Actin was used as the loading control. The relative expression level was normalized by β-Actin
Fig. 4
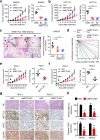
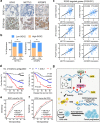
METTL3 drives CRC tumorigenesis and metastasis in vivo. a-b, Subcutaneous tumor models in nude mice showing the tumor growth rate (left) and tumor weights (right) at day 28 after the implantation of METTL3-knockdown and control SW620 and HCT116 cells (n = 5 mice per group). c, Representative H&E staining (scale bar: 100 μm) and quantification of metastatic lung nodules at day 60 after the tail vein injection of METTL3- knockdown or control SW620 cells (n = 5 mice per group). Arrow: metastatic lung nodules. Five sections were evaluated for each lung. d, In vivo limiting dilution assay showing the estimated frequency of CSCs among METTL3-knockdown and control SW620 cells with or without SOX2 overexpression. Response: mice developed subcutaneous tumor (n = 5 mice per group). e-f, Tumor growth rate and tumor weights in two PDX models of intratumoral treatment with siMETTL3 and siNC. g-h, Representative images and quantification of H&E and immunostaining (scale bar: 100 μm) of METTL3, SOX2, and EpCAM in two PDX-based subcutaneous tumor models. All data and error bars are presented as the mean ± SDs. *P < 0.05, **P < 0.01 (Student’s _t_-test)
Fig. 5
IGF2BP2 enhances SOX2 mRNA stability via an m6A-dependent manner. a, Immunoblotting of IGF2BP2 after RNA pull down assay with cell lysate (Ly.), full-length biotinylated-SOX2 (FL), and beads only (NC) in SW620 and HCT116 cells. b, Immunoblotting of IGF2BP2 with cell lysate (Ly.), full-length biotinylated-SOX2 (#1), the SOX2 CDS region with or without m6A motif mutation (#2, #3), the SOX2 3′-UTR region with or without m6A motif mutation (#4, #5), and beads only (NC) in SW620 cells. c, Agarose electrophoresis and real-time PCR analysis of RIP assays in CRC cells showing the direct binding between the IGF2BP2 protein and SOX2 mRNA. d, Correlation between IGF2BP2 and SOX2 expression in TCGA database for COAD, analyzed with the Gene Expression Profiling Interactive Analysis (GEPIA) online analysis tool (
). e, Immunoblotting of SOX2 after IGF2BP2 inhibition in SW620 and HCT116 cells. f, Real-time PCR analysis of SOX2 after IGF2BP2 inhibition in SW620 and HCT116 cells. g, RIP-qPCR showing the enrichment of SOX2 in SW620 after METTL3 inhibition. h, Real-time PCR analysis of SOX2 downstream genes after IGF2BP2 inhibition in SW620 and HCT116 cells. i-j, The decay rate of mRNA and qPCR analysis of SOX2 at the indicated times after actinomycin D (5 μg/ml) treatment in SW620 cells after METTL3 inhibition (left), and in SW620 cells after IGF2BP2 inhibition (right). The data in c, g, h, i and j are presented as the mean ± SDs (n = 3). *P < 0.05, **P < 0.01 (Student’s _t_-test). β-Actin and an IgG antibody was used as the negative control. The relative expression level was normalized by β-Actin. The relative SOX2 enrichment in the RIP assay was normalized by input
Fig. 6
Clinical correlation between METTL3, SOX2 and IGF2BP2 in CRC. a, Representative images showing high or low expression of METTL3, SOX2 and IGF2BP2 in 432 CRC tumor specimens. b, Correlation between SOX2 and METTL3 or IGF2BP2 in CRC microarray specimens. c, Correlation between METTL3 level (left) or IGF2BP2 level (right) and the levels of SOX2 downstream genes, including CCND1, MYC, and POU5F1, in 63 paired CRC tumor tissues and adjacent normal tissues (SYSUCC cohort). d, Kaplan-Meier analysis of overall survival (OS) for CRC patients (n = 432) based on the number of upregulated molecular markers (Kaplan-Meier analysis with log-rank test). METTL3, SOX2, and IGF2BP2 expression was stratified by the individual medians by IHC analysis, and the patients were divided into three groups as indicated. e, ROC curve analysis for OS for METTL3 [AUC = 0.654, (95% CI, 0.607–0.698)], SOX2 [AUC = 0.635, (95% CI, 0.588–0.681)], and IGF2BP2 [AUC = 0.602, (95% CI, 0.554–0.649)] as individual biomarkers or for the combined panel [AUC = 0.703 (95% CI, 0.658–0.746)]. AUC, area under the curve. *P < 0.05, **P < 0.01 (Student’s _t_-test). f, ROC curve analysis for DFS for METTL3 [AUC = 0.612, (95% CI, 0.564–0.658)], SOX2 [AUC = 0.615, (95% CI, 0.568–0.661)], and IGF2BP2 [AUC = 0.591, (95% CI, 0.543–0.637)] as individual biomarkers or for the combined panel [AUC = 0.664 (95% CI, 0.618–0.709)]. AUC, area under a curve. g, Proposed working model of the proposed mechanism in this study. *P < 0.05, **P < 0.01 (Student’s _t_-test)
Similar articles
- m6A-dependent glycolysis enhances colorectal cancer progression.
Shen C, Xuan B, Yan T, Ma Y, Xu P, Tian X, Zhang X, Cao Y, Ma D, Zhu X, Zhang Y, Fang JY, Chen H, Hong J. Shen C, et al. Mol Cancer. 2020 Apr 3;19(1):72. doi: 10.1186/s12943-020-01190-w. Mol Cancer. 2020. PMID: 32245489 Free PMC article. - METTL14-mediated N6-methyladenosine modification of SOX4 mRNA inhibits tumor metastasis in colorectal cancer.
Chen X, Xu M, Xu X, Zeng K, Liu X, Pan B, Li C, Sun L, Qin J, Xu T, He B, Pan Y, Sun H, Wang S. Chen X, et al. Mol Cancer. 2020 Jun 17;19(1):106. doi: 10.1186/s12943-020-01220-7. Mol Cancer. 2020. PMID: 32552762 Free PMC article. - METTL3/IGF2BP2 axis affects the progression of colorectal cancer by regulating m6A modification of STAG3.
Yi J, Peng F, Zhao J, Gong X. Yi J, et al. Sci Rep. 2023 Oct 12;13(1):17292. doi: 10.1038/s41598-023-44379-x. Sci Rep. 2023. PMID: 37828232 Free PMC article. - Review of METTL3 in colorectal cancer: From mechanisms to the therapeutic potential.
Zhang L, Mao Z, Yin K, Wang S. Zhang L, et al. Int J Biol Macromol. 2024 Oct;277(Pt 2):134212. doi: 10.1016/j.ijbiomac.2024.134212. Epub 2024 Jul 26. Int J Biol Macromol. 2024. PMID: 39069066 Review. - Multifaceted Roles of the _N_6-Methyladenosine RNA Methyltransferase METTL3 in Cancer and Immune Microenvironment.
Hu C, Liu J, Li Y, Jiang W, Ji D, Liu W, Ma T. Hu C, et al. Biomolecules. 2022 Jul 28;12(8):1042. doi: 10.3390/biom12081042. Biomolecules. 2022. PMID: 36008936 Free PMC article. Review.
Cited by
- N6-methyladenosine-modified HOTAIRM1 promotes vasculogenic mimicry formation in glioma.
Wu Z, Lin Y, Wei N. Wu Z, et al. Cancer Sci. 2023 Jan;114(1):129-141. doi: 10.1111/cas.15578. Epub 2022 Oct 27. Cancer Sci. 2023. PMID: 36086906 Free PMC article. - Reshaping the role of m6A modification in cancer transcriptome: a review.
Yang G, Sun Z, Zhang N. Yang G, et al. Cancer Cell Int. 2020 Jul 29;20:353. doi: 10.1186/s12935-020-01445-y. eCollection 2020. Cancer Cell Int. 2020. PMID: 32760220 Free PMC article. Review. - Longnon-coding RNA BLACAT2 promotes gastric cancer progression via the miR-193b-5p/METTL3 pathway.
Hu H, Kong Q, Huang XX, Zhang HR, Hu KF, Jing Y, Jiang YF, Peng Y, Wu LC, Fu QS, Xu L, Xia YB. Hu H, et al. J Cancer. 2021 Apr 2;12(11):3209-3221. doi: 10.7150/jca.50403. eCollection 2021. J Cancer. 2021. PMID: 33976730 Free PMC article. - Targeting METTL3 enhances the chemosensitivity of non-small cell lung cancer cells by decreasing ABCC2 expression in an m6A-YTHDF1-dependent manner.
Zhang R, Chen P, Wang Y, Zeng Z, Yang H, Li M, Liu X, Yu W, Hou P. Zhang R, et al. Int J Biol Sci. 2024 Sep 3;20(12):4750-4766. doi: 10.7150/ijbs.97425. eCollection 2024. Int J Biol Sci. 2024. PMID: 39309428 Free PMC article. - m6A Modification of Long Non-Coding RNA HNF1A-AS1 Facilitates Cell Cycle Progression in Colorectal Cancer via IGF2BP2-Mediated CCND1 mRNA Stabilization.
Bian Y, Wang Y, Xu S, Gao Z, Li C, Fan Z, Ding J, Wang K. Bian Y, et al. Cells. 2022 Sep 27;11(19):3008. doi: 10.3390/cells11193008. Cells. 2022. PMID: 36230970 Free PMC article.
References
- Bray Freddie, Ferlay Jacques, Soerjomataram Isabelle, Siegel Rebecca L., Torre Lindsey A., Jemal Ahmedin. Global cancer statistics 2018: GLOBOCAN estimates of incidence and mortality worldwide for 36 cancers in 185 countries. CA: A Cancer Journal for Clinicians. 2018;68(6):394–424. - PubMed
- Xu RH, Muro K, Morita S, Iwasa S, Han SW, Wang W, Kotaka M, Nakamura M, Ahn JB, Deng YH, et al. Modified XELIRI (capecitabine plus irinotecan) versus FOLFIRI (leucovorin, fluorouracil, and irinotecan), both either with or without bevacizumab, as second-line therapy for metastatic colorectal cancer (AXEPT): a multicentre, open-label, randomised, non-inferiority, phase 3 trial. Lancet Oncol. 2018;19:660–671. doi: 10.1016/S1470-2045(18)30140-2. - DOI - PubMed
Publication types
MeSH terms
Substances
LinkOut - more resources
Full Text Sources
Other Literature Sources
Medical
