Revisiting metazoan phylogeny with genomic sampling of all phyla - PubMed (original) (raw)
Revisiting metazoan phylogeny with genomic sampling of all phyla
Christopher E Laumer et al. Proc Biol Sci. 2019.
Erratum in
- Correction to 'Revisiting metazoan phylogeny with genomic sampling of all phyla'.
Laumer CE, Fernández R, Lemer S, Combosch D, Kocot K, Riesgo A, Andrade SCS, Sterrer W, Sørensen MV, Giribet G. Laumer CE, et al. Proc Biol Sci. 2019 Nov 6;286(1914):20191941. doi: 10.1098/rspb.2019.1941. Epub 2019 Nov 6. Proc Biol Sci. 2019. PMID: 31690235 Free PMC article. No abstract available.
Abstract
Proper biological interpretation of a phylogeny can sometimes hinge on the placement of key taxa-or fail when such key taxa are not sampled. In this light, we here present the first attempt to investigate (though not conclusively resolve) animal relationships using genome-scale data from all phyla. Results from the site-heterogeneous CAT + GTR model recapitulate many established major clades, and strongly confirm some recent discoveries, such as a monophyletic Lophophorata, and a sister group relationship between Gnathifera and Chaetognatha, raising continued questions on the nature of the spiralian ancestor. We also explore matrix construction with an eye towards testing specific relationships; this approach uniquely recovers support for Panarthropoda, and shows that Lophotrochozoa (a subclade of Spiralia) can be constructed in strongly conflicting ways using different taxon- and/or orthologue sets. Dayhoff-6 recoding sacrifices information, but can also reveal surprising outcomes, e.g. full support for a clade of Lophophorata and Entoprocta + Cycliophora, a clade of Placozoa + Cnidaria, and raising support for Ctenophora as sister group to the remaining Metazoa, in a manner dependent on the gene and/or taxon sampling of the matrix in question. Future work should test the hypothesis that the few remaining uncertainties in animal phylogeny might reflect violations of the various stationarity assumptions used in contemporary inference methods.
Keywords: animal phylogeny; compositional bias; matrix recoding; phylogenomics; taxon sampling.
Conflict of interest statement
We declare we have no competing interests.
Figures
Figure 1.
Schematic description of gene tree construction, orthologue assignment and matrix construction. Gene selection criteria for clade-specific matrix construction and other methodological details are discussed in the text.
Figure 2.
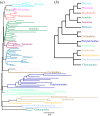
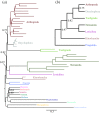
(a) Posterior consensus summary of CAT + GTR + _Γ_4 analysis of reduced, BMGE-trimmed pan-Metazoa matrix in amino acid space, trimmed of four rogue taxa prior to summary. (b) Cladogram depiction of relationships and support within Spiralia recovered in the previous analysis, shown to improve readability. (c) Posterior consensus summary of CAT + GTR + _Γ_4 analysis of the same matrix, recoded into Dayhoff-6 groups and trimmed of six rogue taxa prior to summary. (d) Cladogram depiction of relationships and support within Spiralia recovered in the previous analysis. Nodal support values are posterior probability; unlabelled nodes received full support. Relationships within labelled clades (phyla) are not annotated with support values to improve visualization, except in the case that the monophyly of the clade in question received less than full posterior probability. (Online version in colour.)
Figure 3.
(a) Posterior consensus summary of CAT + GTR + Γ_4 analysis of BMGE-trimmed Spiralia-specific matrix in amino acid space, trimmed of 2 rogue taxa prior to summary; the phylogram is drawn with the position of the root taken from the pan-Metazoa results shown in figure 2_b. Cladogram depiction of the same, given to improve readability. Criteria for nodal annotation are as in figure 2; in this case, no internodes outside the labelled phyla received less than full support.
Figure 4.
(a) Posterior consensus summary of CAT + GTR + Γ_4 analysis of BMGE-trimmed Ecdysozoa-specific matrix in amino acid space, trimmed of Nectonema sp._ (Nematomorpha) due to its behaviour as a rogue taxon prior to summary. (b) Cladogram depiction of ingroup ecdysozoan relationships within this phylogram, given to improve readability. Criteria for nodal annotation are as in figure 2. (Online version in colour.)
Figure 5.
Cladograms depicting metazoan relationships outside Bilateria, summarizing relationships from CAT + GTR + _Γ_4 analysis of the non-Bilateria specific matrix, varied as follows: (a) amino acid matrix with all sampled opisthokont outgroups; (b) the same, recoded into Dayhoff-6 groups; (c) amino acid matrix including only Choanoflagellata as outgroups; (d) the same, recoded into Dayhoff-6 groups. On the matrix pruned of non-choanoflagellate outgroups, BMGE-trimming was performed after pruning, yielding a matrix of 68 337 sites, in contrast to the 61 096 sites retained when all outgroups are included prior to trimming. Trees have been arbitrarily drawn with the root between Apusomonadida and Opisthokonta. (Online version in colour.)
Similar articles
- Extracting phylogenetic signal and accounting for bias in whole-genome data sets supports the Ctenophora as sister to remaining Metazoa.
Borowiec ML, Lee EK, Chiu JC, Plachetzki DC. Borowiec ML, et al. BMC Genomics. 2015 Nov 23;16:987. doi: 10.1186/s12864-015-2146-4. BMC Genomics. 2015. PMID: 26596625 Free PMC article. - Support for the monophyletic origin of Gnathifera from phylogenomics.
Witek A, Herlyn H, Ebersberger I, Mark Welch DB, Hankeln T. Witek A, et al. Mol Phylogenet Evol. 2009 Dec;53(3):1037-41. doi: 10.1016/j.ympev.2009.07.031. Epub 2009 Aug 3. Mol Phylogenet Evol. 2009. PMID: 19654049 - Error, signal, and the placement of Ctenophora sister to all other animals.
Whelan NV, Kocot KM, Moroz LL, Halanych KM. Whelan NV, et al. Proc Natl Acad Sci U S A. 2015 May 5;112(18):5773-8. doi: 10.1073/pnas.1503453112. Epub 2015 Apr 20. Proc Natl Acad Sci U S A. 2015. PMID: 25902535 Free PMC article. - Employing Phylogenomics to Resolve the Relationships among Cnidarians, Ctenophores, Sponges, Placozoans, and Bilaterians.
Whelan NV, Kocot KM, Halanych KM. Whelan NV, et al. Integr Comp Biol. 2015 Dec;55(6):1084-95. doi: 10.1093/icb/icv037. Epub 2015 May 13. Integr Comp Biol. 2015. PMID: 25972566 Review. - Spiralian genomics and the evolution of animal genome architecture.
Liao IJ, Lu TM, Chen ME, Luo YJ. Liao IJ, et al. Brief Funct Genomics. 2023 Nov 17;22(6):498-508. doi: 10.1093/bfgp/elad029. Brief Funct Genomics. 2023. PMID: 37507111 Review.
Cited by
- MATEdb2, a Collection of High-Quality Metazoan Proteomes across the Animal Tree of Life to Speed Up Phylogenomic Studies.
Martínez-Redondo GI, Vargas-Chávez C, Eleftheriadi K, Benítez-Álvarez L, Vázquez-Valls M, Fernández R. Martínez-Redondo GI, et al. Genome Biol Evol. 2024 Nov 1;16(11):evae235. doi: 10.1093/gbe/evae235. Genome Biol Evol. 2024. PMID: 39540856 Free PMC article. - Expression of distal limb patterning genes in Hypsibius exemplaris indicate regionalization and suggest distal identity of tardigrade legs.
Mapalo MA, Game M, Smith FW, Ortega-Hernández J. Mapalo MA, et al. Evodevo. 2024 Nov 13;15(1):15. doi: 10.1186/s13227-024-00235-1. Evodevo. 2024. PMID: 39538290 Free PMC article. - The conserved genetic program of male germ cells uncovers ancient regulators of human spermatogenesis.
Brattig-Correia R, Almeida JM, Wyrwoll MJ, Julca I, Sobral D, Misra CS, Di Persio S, Guilgur LG, Schuppe HC, Silva N, Prudêncio P, Nóvoa A, Leocádio AS, Bom J, Laurentino S, Mallo M, Kliesch S, Mutwil M, Rocha LM, Tüttelmann F, Becker JD, Navarro-Costa P. Brattig-Correia R, et al. Elife. 2024 Oct 10;13:RP95774. doi: 10.7554/eLife.95774. Elife. 2024. PMID: 39388236 Free PMC article. - Acoelomorph flatworm monophyly is a long-branch attraction artefact obscuring a clade of Acoela and Xenoturbellida.
Redmond AK. Redmond AK. Proc Biol Sci. 2024 Sep;291(2031):20240329. doi: 10.1098/rspb.2024.0329. Epub 2024 Sep 18. Proc Biol Sci. 2024. PMID: 39288803 Free PMC article. - A taxon-rich and genome-scale phylogeny of Opisthokonta.
Liu H, Steenwyk JL, Zhou X, Schultz DT, Kocot KM, Shen XX, Rokas A, Li Y. Liu H, et al. PLoS Biol. 2024 Sep 16;22(9):e3002794. doi: 10.1371/journal.pbio.3002794. eCollection 2024 Sep. PLoS Biol. 2024. PMID: 39283949 Free PMC article.
References
- Wanninger A. 2016. Twenty years into the ‘new animal phylogeny’: changes and challenges. Org. Divers. Evol. 16, 315–318. (10.1007/s13127-016-0277-3) - DOI
- Giribet G. 2016. New animal phylogeny: future challenges for animal phylogeny in the age of phylogenomics. Org. Divers. Evol. 16, 419–426. (10.1007/s13127-015-0236-4) - DOI
Publication types
MeSH terms
LinkOut - more resources
Full Text Sources
Other Literature Sources
Miscellaneous


