Understanding climate change from a global analysis of city analogues - PubMed (original) (raw)
. 2019 Jul 10;14(7):e0217592.
doi: 10.1371/journal.pone.0217592. eCollection 2019.
Emily Clark 1, Thomas Elliott 1, Simon Hart 2, Johan van den Hoogen 1, Iris Hordijk 1, Haozhi Ma 1, Sabiha Majumder 1, Gabriele Manoli 3, Julia Maschler 1, Lidong Mo 1, Devin Routh 1, Kailiang Yu 1, Constantin M Zohner 1, Thomas W Crowther 1
Affiliations
- PMID: 31291249
- PMCID: PMC6619606
- DOI: 10.1371/journal.pone.0217592
Understanding climate change from a global analysis of city analogues
Jean-Francois Bastin et al. PLoS One. 2019.
Erratum in
- Correction: Understanding climate change from a global analysis of city analogues.
Bastin JF, Clark E, Elliott T, Hart S, van den Hoogen J, Hordijk I, Ma H, Majumder S, Manoli G, Maschler J, Mo L, Routh D, Yu K, Zohner CM, Crowther TW. Bastin JF, et al. PLoS One. 2019 Oct 16;14(10):e0224120. doi: 10.1371/journal.pone.0224120. eCollection 2019. PLoS One. 2019. PMID: 31618246 Free PMC article.
Abstract
Combating climate change requires unified action across all sectors of society. However, this collective action is precluded by the 'consensus gap' between scientific knowledge and public opinion. Here, we test the extent to which the iconic cities around the world are likely to shift in response to climate change. By analyzing city pairs for 520 major cities of the world, we test if their climate in 2050 will resemble more closely to their own current climate conditions or to the current conditions of other cities in different bioclimatic regions. Even under an optimistic climate scenario (RCP 4.5), we found that 77% of future cities are very likely to experience a climate that is closer to that of another existing city than to its own current climate. In addition, 22% of cities will experience climate conditions that are not currently experienced by any existing major cities. As a general trend, we found that all the cities tend to shift towards the sub-tropics, with cities from the Northern hemisphere shifting to warmer conditions, on average ~1000 km south (velocity ~20 km.year-1), and cities from the tropics shifting to drier conditions. We notably predict that Madrid's climate in 2050 will resemble Marrakech's climate today, Stockholm will resemble Budapest, London to Barcelona, Moscow to Sofia, Seattle to San Francisco, Tokyo to Changsha. Our approach illustrates how complex climate data can be packaged to provide tangible information. The global assessment of city analogues can facilitate the understanding of climate change at a global level but also help land managers and city planners to visualize the climate futures of their respective cities, which can facilitate effective decision-making in response to on-going climate change.
Conflict of interest statement
The authors have declared that no competing interests exist.
Figures
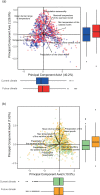
Fig 1. Distribution of current and future cities along the first 4 principal component axes.
The seven major climate variables contributing to the Principal Component Analysis (PCA) are superposed on each figure. The figure at the top (a) shows the distribution of current (blue) and future (red) cities on the space defined by the first two principal components. The first two axes explain, respectively, 40.2 and 26.9% of climate variations. The first axis is mainly driven by differences in temperature seasonality and in minimum temperature of the coldest month, while the second axis is mainly driven by differences in precipitation seasonality. The figure at the bottom (b) shows the same current (green) and future (orange) cities on the space defined by the third and fourth principal components. They explain respectively 10.5 and 7.6% of climate variations. The third axis is mainly driven by changes in precipitation of the wet season, while the fourth axis is mainly driven by changes in the mean diurnal temperature range. Boxplots illustrates the distribution of the points along each of the 4 axes. The continuous line in the boxes represents the median of the distribution, the extremities of the boxes the 1st and the 3rd quartile and the continuous lines go up to 1.5 times the difference between the 3st and the 1rd quartile.
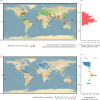
Fig 2. Extent of climate changes in major cities of the world by 2050.
a, b, the extent of change in climate conditions. Cities predicted to have climates that no major city has experienced before are colored in red (mostly within the tropics). Cities for which future climate conditions reflect current conditions in other major cities of the world are shown in green. The size of the dots represents the magnitude of change between current and future climate conditions. b, The proportion of cities shifting away from the covered climate domain (concentrated in the tropics). c,d, The extent of latitudinal shifts in relation to the equatorial line. Cities shifting towards the equator are colored with a blue gradient (mostly outside the tropics), while cities shifting away from the equator are colored with a yellow to red gradient (mostly within the tropics). d, A summary of the shift by latitude is illustrated in a barchart, with shifts averaged by bins of 5 degrees. The background of the maps are a combination rasters available in the public domain, i.e. of USGS shaded relief only and hydro cached.
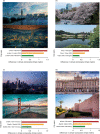
Fig 3. Future cities and similar current climate counterpart.
Difference between future and current climate for four cities and an example of their similar current counterpart. Illustration of the results of the analysis for London (a; counterpart: Barcelona), Buenos Aires (b; counterpart: Sidney), Nairobi (c; counterpart:Beirut) and Portland (d; counterpart:San Antonio). The red bar represents the difference between the current climate of the city of interest (e.g. London in (a)) and the current climate of the city to which the city of interest (e.g. London in (a)) will have the most similar climate by 2050 (e.g. Barcelona in (a)). The yellow bar the difference between the current and future climate of the city of interest (e.g. current London and London 2050 in (a)). The green bar represents the difference between the future climate of the city of interest (London 2050) and the current climate of the most similar counterpart (e.g. Barcelona in (a)). Images of Barcelona and London were obtained on Pixabay, shared under common creative CC0 license.
Fig 4. Latitudinal shift of cities relative to their distance to the equator (in degrees).
Cities below 20 degrees North/South tend to move away from the equator (positive latitudinal shift) while cities beyond 20 degrees North/South tend to move closer to the equator (negative latitudinal shift). Cities are colored according to the aggregated ecoregion of the world [36] to which they belong, with the tropical in red, the subtropical in orange, the temperate in green and the boreal in blue.
Similar articles
- Analysis and modelling of surface Urban Heat Island in 20 Canadian cities under climate and land-cover change.
Gaur A, Eichenbaum MK, Simonovic SP. Gaur A, et al. J Environ Manage. 2018 Jan 15;206:145-157. doi: 10.1016/j.jenvman.2017.10.002. Epub 2017 Oct 20. J Environ Manage. 2018. PMID: 29059569 - City to city learning and knowledge exchange for climate resilience in southern Africa.
Ndebele-Murisa MR, Mubaya CP, Pretorius L, Mamombe R, Iipinge K, Nchito W, Mfune JK, Siame G, Mwalukanga B. Ndebele-Murisa MR, et al. PLoS One. 2020 Jan 24;15(1):e0227915. doi: 10.1371/journal.pone.0227915. eCollection 2020. PLoS One. 2020. PMID: 31978090 Free PMC article. - Decision making for independent municipal action.
Kurth M, Fox-Lent C, Golan M, Linkov I. Kurth M, et al. Integr Environ Assess Manag. 2018 Mar;14(2):194-197. doi: 10.1002/ieam.2013. Integr Environ Assess Manag. 2018. PMID: 29193832 - Priority focus areas for a sub-national response to climate change and health: A South African provincial case study.
Godsmark CN, Irlam J, van der Merwe F, New M, Rother HA. Godsmark CN, et al. Environ Int. 2019 Jan;122:31-51. doi: 10.1016/j.envint.2018.11.035. Epub 2018 Dec 18. Environ Int. 2019. PMID: 30573189 Review. - Re-engineering cities: a framework for adaptation to global change.
Dawson R. Dawson R. Philos Trans A Math Phys Eng Sci. 2007 Dec 15;365(1861):3085-98. doi: 10.1098/rsta.2007.0008. Philos Trans A Math Phys Eng Sci. 2007. PMID: 17855224 Review.
Cited by
- Response of Carex breviculmis to phosphorus deficiency and drought stress.
Jiang S, Tang Y, Fan R, Bai S, Wang X, Huang Y, Li W, Ji W. Jiang S, et al. Front Plant Sci. 2023 Jul 11;14:1203924. doi: 10.3389/fpls.2023.1203924. eCollection 2023. Front Plant Sci. 2023. PMID: 37496859 Free PMC article. - Nonhomologous end joining as key to CRISPR/Cas-mediated plant chromosome engineering.
Gehrke F, Schindele A, Puchta H. Gehrke F, et al. Plant Physiol. 2022 Mar 28;188(4):1769-1779. doi: 10.1093/plphys/kiab572. Plant Physiol. 2022. PMID: 34893907 Free PMC article. - A Comparative Study of the Physiological and Socio-Economic Vulnerabilities to Heat Waves of the Population of the Metropolis of Lyon (France) in a Climate Change Context.
Alonso L, Renard F. Alonso L, et al. Int J Environ Res Public Health. 2020 Feb 5;17(3):1004. doi: 10.3390/ijerph17031004. Int J Environ Res Public Health. 2020. PMID: 32033377 Free PMC article. - Spatiotemporal characterization of heatwave exposure across historically vulnerable communities.
Bhattarai S, Bista S, Sharma S, White LD, Amini F, Talchabhadel R. Bhattarai S, et al. Sci Rep. 2024 Sep 6;14(1):20882. doi: 10.1038/s41598-024-71704-9. Sci Rep. 2024. PMID: 39242752 Free PMC article. - A Weather Forecast Model Accuracy Analysis and ECMWF Enhancement Proposal by Neural Network.
Frnda J, Durica M, Nedoma J, Zabka S, Martinek R, Kostelansky M. Frnda J, et al. Sensors (Basel). 2019 Nov 24;19(23):5144. doi: 10.3390/s19235144. Sensors (Basel). 2019. PMID: 31771275 Free PMC article.
References
- Nisbet EC, Cooper KE, Garrett RK. The Partisan Brain Suhay E, Druckman JN, editors. Ann Am Acad Pol Soc Sci. SAGE PublicationsSage CA: Los Angeles, CA; 2015;658: 36–66. 10.1177/0002716214555474 - DOI
- Zaval L, Cornwell JFM. Effective education and communication strategies to promote environmental engagement. Eur J Educ. 2017;52: 477–486. 10.1111/ejed.12252 - DOI
- Kahan DM. Climate-Science Communication and the Measurement Problem. Polit Psychol. Wiley/Blackwell (10.1111); 2015;36: 1–43. 10.1111/pops.12244 - DOI
- Marx SM, Weber EU, Orlove BS, Leiserowitz A, Krantz DH, Roncoli C, et al. Communication and mental processes: Experiential and analytic processing of uncertain climate information. Glob Environ Chang. Pergamon; 2007;17: 47–58. 10.1016/J.GLOENVCHA.2006.10.004 - DOI
Publication types
MeSH terms
LinkOut - more resources
Full Text Sources
Medical
Research Materials
Miscellaneous


