M1 Macrophages Induce PD-L1 Expression in Hepatocellular Carcinoma Cells Through IL-1β Signaling - PubMed (original) (raw)
M1 Macrophages Induce PD-L1 Expression in Hepatocellular Carcinoma Cells Through IL-1β Signaling
Zhaoyun Zong et al. Front Immunol. 2019.
Abstract
Hepatocellular carcinoma (HCC) is a prototype of inflammation-related cancer, harboring M1-like and M2-like tumor-associated macrophages. M1 macrophages are thought to be tumoricidal, but some studies report its pro-tumor role. The programmed cell death-ligand (PD-L) 1 expressed in HCC cells is a critical checkpoint molecule to mediate immune escape of HCC. The PD-L1 expression in HCC cells is inducible. In the present study, we ask whether M1 macrophages induce the expression of PD-L1 in HCC cells. First, an association between M1 macrophage infiltration and PD-L1 expression in HCC tissues was determined by bioinformatics and immunohistochemistry experiments. The enrichment score of M1 macrophages was correlated to PD-L1 expression in 90 HCC samples from GEO database. Besides, infiltration of CD68+HLA-DR+ M1-like macrophages correlated with PD-L1 expression level in HCC cells. Moreover, M1-conditioned media was prepared from M1 macrophages derived from THP-1 cell, RAW264.7 cell or murine bone marrow. These supernatants induced expression of PD-L1 in HCC cells. Furthermore, inflammatory cytokine IL-1β in the supernatants was identified to account for the inducible PD-L1 expression by siRNA assay and receptor blockade assay. Additionally, transcription factor p65 and IRF1 in the HCC cells were revealed by CHIP assay to mediate the inducible PD-L1 expression. All the results demonstrate that M1 macrophages induced expression of PD-L1 in HCC cells, supporting the pro-tumor role of M1 macrophages.
Keywords: B7-H1; CD274; PD-L1; hepatocellular carcinomas; macrophages.
Figures
Figure 1
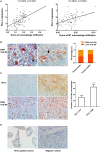
M1-like macrophages infiltration was associated with PD-L1 expression in HCC cells (A) The relationship between enrichment of macrophages or M1 macrophages and PD-L1 expression in HCC samples from GEO database. (B) The distribution of CD68+ HLA-DR+ M1 macrophage in HCC tissue. Double immunohistochemical staining was performed by using anti-CD68 and anti-HLA-DR. The black arrow points to CD68+ macrophages while the white arrow points to CD68+ HLA-DR+ M1-like macrophages. (C) The association of PD-L1 expression with infiltration of M1 macrophages in HCC tissues. PD-L1 expression and M1-like macrophage distribution were detected in serial sections from the same HCC paraffin tissue. The number of CD68+ HLA-DR+ macrophages in the PD-L1+ region was higher than that in PD-L1− region. (D) Positive and negative controls. A placental chorionic tissue was used as positive control (left). Negative controls were performed by omitting the primary antibodies (right). The data are presented as mean±SD. ** p < 0.01.
Figure 2
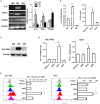
M1 macrophages derived from THP-1 cell upregulated expression of PD-L1 in human HCC cells. THP-1 cells were treated by PMA for 6h, then activated by LPS or IL-4 for 18h. THP-1 (PMA), THP-1(PMA + IFN-γ + LPS), or THP-1(PMA + IL-4) was polarized into macrophages with M0, M1 or M2 phenotype. (A) Expression of IL-6, TNF and CD209 was quantified by RT-PCR. (B) Expression of IL-1β mRNA was determined by quantitative RT-PCR while expression of IL-1β protein in M1S or M2S was examined by ELISA assay. (C) HLA-DRα expression was detected by Western blot assay. (D) PD-L1 expression in HCC cells treated with medium, M0S, M1S, or M2S was determined by quantitative RT-PCR. (E) PD-L1 expression in HCC cells treated with medium, M0S, M1S, or M2S was determined by flow cytometry. The experiment was carried out in triplicate and repeated at least twice. Data are shown as means ± SD. *P < 0.05, **P < 0.01, ***P < 0.001.
Figure 3
M1 macrophages derived from RAW264.7 cell upregulated expression of PD-L1 in murine HCC cells. RAW264.7 cells were stimulated by LPS or IL-4 and polarized into RAW264.7(LPS) or RAW264.7 (IL-4) cells with M1 or M2 phenotype, respectively. RAW264.7 cells without stimulation were defined as M0. (A) Expression of IL-6, TNF-α, iNOS, CD206 and Arg-1 was detected by RT-PCR. (B) Expression of IL-1β was determined by quantitative RT-PCR. (C) PD-L1 mRNA expression in Hepa 1-6 cells treated with medium, M0S, M1S, M2S, LPS, or IL-4 was quantified by quantitative RT-PCR. (D) PD-L1 expression at protein level in Hepa 1-6 cells treated with medium, M0S, M1S, M2S, LPS, or IL-4 was determined by flow cytometry. Similar results were obtained in two independent experiments performed in triplicate. Data are shown as means ± SD. **P < 0.01, ***P < 0.001.
Figure 4
M1 macrophages derived from BMDM upregulated expression of PD-L1 in murine HCC cells**. (A)** Bone marrow cells from C57BL/6 mouse were cultured with M-CSF for 7 days. Flow cytometry assay was performed to identify mature BMDM by using F4/80 and CD11b as identification markers. (B) BMDMs were stimulated by LPS or IL-4 for 12 h to generate BMDMs (LPS) or BMDMs (IL-4) with M1 or M2 phenotype, respectively. The BMDMs without stimulation were defined as M0. Expression of IL-6, TNF-α, iNOS, CD206 and Arg-1 was detected by RT-PCR. (C) Expression of IL-1β was determined by quantitative RT-PCR. (D) PD-L1 mRNA expression in the Hepa 1-6 cells treated with medium, M0S, M1S, M2S, LPS or IL-4 was quantified by RT-PCR assay. (E) PD-L1 protein expression in the Hepa 1-6 cells treated with medium, M0S, M1S, M2S, LPS, or IL-4 was quantified by flow cytometry. The experiment was carried out in triplicate and repeated at least twice. Data are shown as means ± SD. *P < 0.05, **P < 0.01, ***P < 0.001.
Figure 5
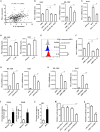
IL-1β signaling was responsible for PD-L1 expression in HCC cells induced by M1 macrophages. (A) Co-expression of IL-1β and PD-L1 gene in HCC samples from TCGA database. (B) HCC cells were transfected with siNC or siIL-1R1, then cultured in the presence or absence of M1S. The PD-L1 expression in these HCC cells was determined by quantitative RT-PCR assay. (C) Huh7 cells pretreated with IL-1Ra were cultured in the presence or absence of M1S. The PD-L1 expression was detected by quantitative RT-PCR. (D) HCC (BEL-7402 or Huh7) cells were stimulated with IL-1β. The PD-L1 expression was detected by quantitative RT-PCR. (E) Huh7 cells were stimulated with IL-1β. The PD-L1 expression was detected by flow cytometry. (F) Huh7 cells were transfected with siNC, siP65, or siIRF1, then cultured in the presence or absence of IL-1β. The PD-L1 expression was determined by quantitative RT-PCR assay. (G,H) HCC cells were transfected with siNC, siP65, or siIRF1, then cultured in the presence or absence of M1S. The PD-L1 expression was determined by quantitative RT-PCR assay. (I,J) BEL-7402 cells were treated with or without M1S, then, CHIP assay was performed to assess the occupancy of transcription factor P65 or IRF1 on the PD-L1 promoter. (K,L) BEL-7402 cells were co-transfected with the mixture of internal control plasmid pRL-TK and luciferase reporter plasmid pGL3-PD-L1, pGL3-mut-p65A, pGL3-mut-p65B, pGL3-mut-p65A+B, or pGL3-mut-IRF1, then treated with M1S. The relative luciferase activities were measured by dual-luciferase reporter assay. The experiment was carried out in triplicate and repeated at least twice. Data are shown as means ± SD. *P < 0.05, **P < 0.01, ***P < 0.001.
Similar articles
- Expression of tumor-associated macrophages and PD-L1 in patients with hepatocellular carcinoma and construction of a prognostic model.
Kong P, Yang H, Tong Q, Dong X, Yi MA, Yan D. Kong P, et al. J Cancer Res Clin Oncol. 2023 Sep;149(12):10685-10700. doi: 10.1007/s00432-023-04949-y. Epub 2023 Jun 12. J Cancer Res Clin Oncol. 2023. PMID: 37306737 Free PMC article. - Disruption of tumour-associated macrophage trafficking by the osteopontin-induced colony-stimulating factor-1 signalling sensitises hepatocellular carcinoma to anti-PD-L1 blockade.
Zhu Y, Yang J, Xu D, Gao XM, Zhang Z, Hsu JL, Li CW, Lim SO, Sheng YY, Zhang Y, Li JH, Luo Q, Zheng Y, Zhao Y, Lu L, Jia HL, Hung MC, Dong QZ, Qin LX. Zhu Y, et al. Gut. 2019 Sep;68(9):1653-1666. doi: 10.1136/gutjnl-2019-318419. Epub 2019 Mar 22. Gut. 2019. PMID: 30902885 - IL-6 promotes PD-L1 expression in monocytes and macrophages by decreasing protein tyrosine phosphatase receptor type O expression in human hepatocellular carcinoma.
Zhang W, Liu Y, Yan Z, Yang H, Sun W, Yao Y, Chen Y, Jiang R. Zhang W, et al. J Immunother Cancer. 2020 Jun;8(1):e000285. doi: 10.1136/jitc-2019-000285. J Immunother Cancer. 2020. PMID: 32581055 Free PMC article. - Programmed cell death protein-1 (PD-1)/programmed death-ligand-1 (PD-L1) axis in hepatocellular carcinoma: prognostic and therapeutic perspectives.
Mocan T, Sparchez Z, Craciun R, Bora CN, Leucuta DC. Mocan T, et al. Clin Transl Oncol. 2019 Jun;21(6):702-712. doi: 10.1007/s12094-018-1975-4. Epub 2018 Nov 1. Clin Transl Oncol. 2019. PMID: 30387047 Review. - Defects in Macrophage Reprogramming in Cancer Therapy: The Negative Impact of PD-L1/PD-1.
Cai H, Zhang Y, Wang J, Gu J. Cai H, et al. Front Immunol. 2021 Jun 23;12:690869. doi: 10.3389/fimmu.2021.690869. eCollection 2021. Front Immunol. 2021. PMID: 34248982 Free PMC article. Review.
Cited by
- The immune landscape of hepatocellular carcinoma-where we are?
Gryziak M, Wozniak K, Kraj L, Rog L, Stec R. Gryziak M, et al. Oncol Lett. 2022 Sep 27;24(5):410. doi: 10.3892/ol.2022.13530. eCollection 2022 Nov. Oncol Lett. 2022. PMID: 36245826 Free PMC article. Review. - Exosomal miR-628-5p from M1 polarized macrophages hinders m6A modification of circFUT8 to suppress hepatocellular carcinoma progression.
Wang L, Yi X, Xiao X, Zheng Q, Ma L, Li B. Wang L, et al. Cell Mol Biol Lett. 2022 Dec 6;27(1):106. doi: 10.1186/s11658-022-00406-9. Cell Mol Biol Lett. 2022. PMID: 36474147 Free PMC article. - Pan-cancer Landscape of Programmed Death Ligand-1 and Programmed Death Ligand-2 Structural Variations.
Hoskins EL, Samorodnitsky E, Wing MR, Reeser JW, Hopkins JF, Murugesan K, Kuang Z, Vella R, Stein L, Risch Z, Yu L, Adebola S, Paruchuri A, Carpten J, Chahoud J, Edge S, Kolesar J, McCarter M, Nepple KG, Reilley M, Scaife C, Tripathi A, Single N, Huang RSP, Albacker LA, Roychowdhury S. Hoskins EL, et al. JCO Precis Oncol. 2023 Jan;7:e2200300. doi: 10.1200/PO.22.00300. JCO Precis Oncol. 2023. PMID: 36623238 Free PMC article. - Comprehensive characterization of B7 family members in NSCLC and identification of its regulatory network.
Xiao M, Pang C, Xiang S, Zhao Y, Wu X, Li M, Du F, Chen Y, Wang F, Wen Q, Xiao Z, Yang Z, Shen J. Xiao M, et al. Sci Rep. 2023 Mar 15;13(1):4311. doi: 10.1038/s41598-022-26776-w. Sci Rep. 2023. PMID: 36922519 Free PMC article. - Multi-omics analysis of macrophage-associated receptor and ligand reveals a strong prognostic signature and subtypes in hepatocellular carcinoma.
Zhao Y, Chen C, Chen K, Sun Y, He N, Zhang X, Xu J, Shen A, Zhao S. Zhao Y, et al. Sci Rep. 2024 May 28;14(1):12163. doi: 10.1038/s41598-024-62668-x. Sci Rep. 2024. PMID: 38806553 Free PMC article.
References
Publication types
MeSH terms
Substances
LinkOut - more resources
Full Text Sources
Medical
Research Materials


