Regulation of Co-transcriptional Pre-mRNA Splicing by m6A through the Low-Complexity Protein hnRNPG - PubMed (original) (raw)
Regulation of Co-transcriptional Pre-mRNA Splicing by m6A through the Low-Complexity Protein hnRNPG
Katherine I Zhou et al. Mol Cell. 2019.
Abstract
N6-methyladenosine (m6A) modification occurs co-transcriptionally and impacts pre-mRNA processing; however, the mechanism of co-transcriptional m6A-dependent alternative splicing regulation is still poorly understood. Heterogeneous nuclear ribonucleoprotein G (hnRNPG) is an m6A reader protein that binds RNA through RRM and Arg-Gly-Gly (RGG) motifs. Here, we show that hnRNPG directly binds to the phosphorylated carboxy-terminal domain (CTD) of RNA polymerase II (RNAPII) using RGG motifs in its low-complexity region. Through interactions with the phosphorylated CTD and nascent RNA, hnRNPG associates co-transcriptionally with RNAPII and regulates alternative splicing transcriptome-wide. m6A near splice sites in nascent pre-mRNA modulates hnRNPG binding, which influences RNAPII occupancy patterns and promotes exon inclusion. Our results reveal an integrated mechanism of co-transcriptional m6A-mediated splicing regulation, in which an m6A reader protein uses RGG motifs to co-transcriptionally interact with both RNAPII and m6A-modified nascent pre-mRNA to modulate RNAPII occupancy and alternative splicing.
Keywords: CTD domain; RBMX; RGG; RNA polymerase II; co-transcription; hnRNPG; low complexity region; m6A; splicing.
Copyright © 2019 Elsevier Inc. All rights reserved.
Conflict of interest statement
Declaration of Interests
The authors declare no competing interests.
Figures
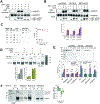
Figure 1:. hnRNPG interacts with RNA polymerase II in vivo.
A. Western blot showing co-immunoprecipitation (co-IP) of Ser5-phosphorylated RNAPII (RNAPII S5P) with hnRNPG in whole cell or chromatin extracts. in: input; un: unbound; hnG IP: hnRNPG IP; hnG Ab: hnRNPG antibody; ctrl: isotype control IP. B. Western blot showing co-IP of RNAPII with hnRNPG in chromatin extracts of cells treated with 0.5% v/v DMSO, 5 μg/mL actinomycin D (actD), or 100 μM DRB for 2 hours. RNAPII co-IP plotted relative to DMSO-treated cells and normalized to hnRNPG IP and to input: (RNAPIIIP / hnRNPGIP) / (RNAPIIinput / hnRNPGinput). Error bars: ± 1 standard deviation; n = 3 biological replicates; n.s., not significant; * p < 0.05, ** p < 0.01 by two-sample t-test. C. Western blot showing co-IP of RNAPII S5P with hnRNPG in chromatin extracts of cells treated with 0.12% v/v DMSO or 6 μM camptothecin (CPT) for 5 hours. RNAPII co-IP plotted relative to DMSO-treated cells. Error bars: ± 1 standard deviation; n = 3 biological replicates; *** p < 0.001 by two-sample t-test. D. Western blot showing co-IP of RNAPII S5P with hnRNPG in chromatin extracts treated with RNase A. n = 2 biological replicates. RNAPII S5P co-IP plotted relative to no RNase treatment. E. Western blot showing co-IP of RNAPII S5P with FLAG–hnRNPG in chromatin extracts of cells transfected hnRNPG siRNA and pCMV3-Flag-RBMX plasmid (WT, RRMmut, RGG1mut, or RGG2mut). RNAPII co-IP measured relative to WT. Error bars: ± 1 standard deviation; n = 3 biological replicates; * p < 0.05 by two-sample t-test. F. Western blot showing co-IP of RNAPII S5P with hnRNPG in chromatin extracts of cells transfected with control (ctrl) or METTL3 (M3) siRNA. RNAPII co-IP plotted relative to control. Error bars: ± 1 standard deviation; n = 4 biological replicates; n.s., not significant by two-sample t-test. See also Figure S1.
Figure 2:. hnRNPG binds directly to phosphorylated RNAPII CTD and can simultaneously interact with both RNA and CTD.
A. Western blot showing pull-down of recombinant hnRNPG with GST-tagged RNAPII CTD (GST–CTD) ± pre-treatment with CDK7, CDK9, and ATP. GST–pCTD: phosphorylated GST–CTD. Quantitation in Figure 2B. B. Western blot showing pull-down of recombinant hnRNPG ± MALAT1 RNA hairpin containing A (2515-A) or m6A (2515-m6A) with the GST–CTD ± phosphorylation by CDK7 or CDK9. Quantitation normalized to hnRNPG IP and to input: (RNAPIIIP / hnRNPGIP) / (RNAPIIinput / hnRNPGinput). n = 3 replicates. C. Filter spotting showing RNA binding to recombinant hnRNPG by spin-down assay. Plot shows percent of bound MALAT1 RNA hairpin at varying concentrations of S5P-peptide. n = 3 independent experiments. D. Silver stained denaturing protein gel showing GST–pCTD binding (S5P by CDK7) to recombinant hnRNPG by spin-down assay. s: supernatant; p: pellet; +2515-A: with equimolar MALAT1 RNA hairpin. A and m6A superscripts correspond to addition of MALAT1 RNA with A or m6A. HnRNPG runs as two bands due to variable N-glycosylation. Fraction pCTD in the pellet refers to [GST-pCTD] / ([GST-pCTD] + [GST-CTD]). Dashed line shows the fraction of hnRNPG in the pellet in the absence of GST-pCTD or RNA. n = 3 replicates. E. Denaturing protein gel showing time points from limited proteolysis of wild-type hnRNPG ± MALAT1 RNA hairpin (2515-A/m6A) by proteinase K. Plot showing half-life (t1/2) of wild-type and mutant hnRNPG proteolysis by proteinase K, with or without pre-binding to equimolar 2515-A, 2515-m6A, SMN2exon7, or WEc RNA, normalized to no RNA. Error bars: ± 1 standard deviation; n = 3–5 replicates; n.s., not significant by two-sample t-test; * p < 0.05, ** _p_ < 0.01. F. Silver stained denaturing protein gel showing GST–pCTD binding (S5P by CDK7) to wild-type and mutant hnRNPG by spin-down assay. s: supernatant; p: pellet. Plot of relative affinity 1-%pCTD(pellet) / %pCTD(input) where _y_ >0 corresponds to pCTD binding. See also Figure S2.
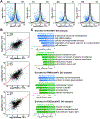
Figure 3:. The RRM, RGG1, and RGG2 regions function in regulation of transcript abundance by hnRNPG.
A. Volcano plots showing log2(fold change) and −log10(_p_-value) for changes in gene expression in NCV, RRMmut, RGG1mut, and RGG2mut relative to WT. Genes satisfying the π value threshold (see methods) were considered differentially expressed. Numbers of down- and up-regulated genes are listed at the top left and right sides, respectively, of each plot. Black curves, π value threshold; blue points, differentially expressed exons; gray points, non-differentially expressed exons. B. Correlated changes in gene expression, quantified as log2(fold change relative to WT), in mRNA sequencing data for RRMmut, RGG1mut, and RGG2mut. Each point is a gene. r, Pearson correlation coefficient; p, _p_-value using Fisher transformation; red line, model II major axis linear regression. C. Gene ontology (GO) analysis showing false discovery rate (FDR) adjusted _p_-value (−log10) for biological processes (blue) and cellular components (green) enriched among genes differentially expressed relative to WT. Red line: FDR threshold (p = 0.05). Number (n) of genes in each category from top to bottom: NCV/WT biological process (n = 295, 214, 215, 32, 68), cellular component (n = 186, 122, 116, 275, 236); RRMmut/WT biological process (n = 18, 13), cellular component (n = 156, 9, 176, 170); RGG2mut/WT cellular component (n = 10, 97, 130). See also Figure S3 and Table S1.
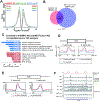
Figure 4:. hnRNPG and m6A methyltransferase co-regulate exon splicing.
A. Distribution of differentially expressed exons showing number of exons at each log2(fold change) for hnRNPG (red), METTL3 (green), and METTL14 (blue) knockdown relative to control knockdown (Liu et al., 2017). Numbers of down- and up-regulated differentially expressed exons for each knockdown are listed at the top left and right corners of the plot in the color of the knockdown. B. Venn diagram showing overlap between exons differentially expressed upon hnRNPG knockdown (39506) and upon METTL3 or METTL14 knockdown (83517). Overlapping exons are co-regulated exons (Co-reg, 18031), with correlated changes in expression upon hnRNPG KD and either METTL3 or METTL14 KD. C. GO analysis showing false discovery rate (FDR) adjusted _p_-value (−log10) for biological processes (blue) and molecular functions (red) enriched among genes containing differentially expressed exons that were co-regulated by hnRNPG KD and either METTL3 or METTL14 KD. Red line: FDR threshold (p = 0.05). D. HnRNPG-bound m6A sites per regulated exon at each site in the −250 to +250 nucleotide region around the splice sites of exons co-down-regulated (11996), co-up-regulated (9818), or not regulated (140932) upon hnRNPG KD and either METTL3 or METTL14 KD. * p < 10−16 by paired t-test between curves for down- vs up-regulated exons. E. Same as (D) but using hnRNPG binding sites from chromatin associated PAR-CLIP data. F. Sequencing track of VPRBP gene showing read density by chromatin-associated hnRNPG PAR-CLIP. T-to-C and T-to-A mutations (marks of cross-linking in PAR-CLIP) are shown as green and orange vertical lines. rep: biological replicate; si-C: control siRNA; si-hnG: hnRNPG siRNA. RRACH motifs: red; m6A sites: black. See also Figure S4 and Table S2.
Figure 5:. The RRM, RGG1, and RGG2 regions function in regulation of alternative splicing by hnRNPG.
A. Volcano plots showing log2(fold change) and −log10(_p_-value) for changes in exon expression in NCV, RRMmut, RGG1mut, and RGG2mut relative to WT. Exons satisfying the π value threshold (see methods) were considered differentially expressed. Numbers of down- and up-regulated differentially expressed exons are listed at the top left and right corners of each plot. Black curves, π value threshold; blue points, differentially expressed exons; gray points, non-differentially expressed exons. B. Distribution of differentially expressed exons showing number of exons at each log2(fold change) for RRMmut (red), RGG1mut (green), and RGG2mut (blue) relative to WT. Numbers of down- and up- regulated differentially expressed exons for each mutant are listed at the top left and top right corners of the plot, in the color of the mutant. C. mRNA-seq reads for NASP transcripts in NCV (gray), WT (black), RRMmut (red), RGG1mut (green), RGG2mut (blue) expressing cells. Sashimi plot shows down-regulation of the middle exon in NCV, RRMmut, RGG1mut, and RGG2mut compared to WT cells. D. Correlated changes in exon expression, quantified as log2(fold change relative to WT), in mRNA sequencing data for RRMmut, RGG1mut, and RGG2mut. Each point is an exon. r, Pearson correlation coefficient; p, _p_-value using Fisher transformation; red line, model II major axis linear regression. See also Figures S5 and S6, and Table S1.
Figure 6:. Role of m6A site position in regulation of alternative splicing by hnRNPG.
A. Distribution of hnRNPG-bound m6A sites per regulated exon at each site in the −250 to +250 nucleotide region around the splice sites of exons down-regulated (red) or up-regulated (blue) in NCV (1317 down, 1279 up), RRMmut (4460 down, 1099 up), RGG1mut (654 down, 513 up), and RGG2mut (4543 down, 1129 up) relative to WT. * p < 10−16 by paired t-test between curves for down- vs up-regulated exons. B. Overlay curves from (A) for RRMmut, RGG1mut, and RGG2mut. C. Same as (A) but using hnRNPG binding sites from chromatin-associated PAR-CLIP data. See also Figure S6.
Figure 7:. m6A-dependent regulation of alternative splicing by hnRNPG and RNAPII occupancy.
A. RNAPII ChIP-seq upon hnRNPG knockdown, using total RNAPII antibody. si-C: control knockdown; hnG1, hnG2: hnRNPG knockdown with two siRNAs. Co-regulated exons down- (dn, 15318), up-(up, 11255), and non-regulated (non, 35377) upon hnRNPG or METTL3/14 knockdown. * p < 10−4. B. Same as (A) using S2P-CTD antibody. C. Same as (A) using S5P-CTD antibody. D. ChIP-seq tracks from KIAA0895L gene using RNAPII-S2P antibody in cells treated with control or hnRNPG siRNA. si-C: control siRNA; si-hnG1, si-hnG2: hnRNPG knockdown with two siRNAs. RRACH motifs: red; m6A sites: black. E. Model for m6A-dependent regulation of exon inclusion by hnRNPG. Red circle: m6A site; red box: alternative exon; gray: constitutive exon; black lines: DNA; green: RNAPII with CTD as extended line; cyan: hnRNPG complex. RNAPII transcribes through the splice site, m6A is installed, and hnRNPG interacts with m6A, causing RNAPII to increase dwell time downstream of the m6A site, which results in hnRNPG- and m6A-dependent exon inclusion. See also Figure S7 and Table S3.
Similar articles
- N6-methyladenosine alters RNA structure to regulate binding of a low-complexity protein.
Liu N, Zhou KI, Parisien M, Dai Q, Diatchenko L, Pan T. Liu N, et al. Nucleic Acids Res. 2017 Jun 2;45(10):6051-6063. doi: 10.1093/nar/gkx141. Nucleic Acids Res. 2017. PMID: 28334903 Free PMC article. - DBIRD complex integrates alternative mRNA splicing with RNA polymerase II transcript elongation.
Close P, East P, Dirac-Svejstrup AB, Hartmann H, Heron M, Maslen S, Chariot A, Söding J, Skehel M, Svejstrup JQ. Close P, et al. Nature. 2012 Mar 25;484(7394):386-9. doi: 10.1038/nature10925. Nature. 2012. PMID: 22446626 Free PMC article. - Cap-binding protein complex links pre-mRNA capping to transcription elongation and alternative splicing through positive transcription elongation factor b (P-TEFb).
Lenasi T, Peterlin BM, Barboric M. Lenasi T, et al. J Biol Chem. 2011 Jul 1;286(26):22758-68. doi: 10.1074/jbc.M111.235077. Epub 2011 May 2. J Biol Chem. 2011. PMID: 21536667 Free PMC article. - On the importance of being co-transcriptional.
Neugebauer KM. Neugebauer KM. J Cell Sci. 2002 Oct 15;115(Pt 20):3865-71. doi: 10.1242/jcs.00073. J Cell Sci. 2002. PMID: 12244124 Review. - Polyadenylation site selection: linking transcription and RNA processing via a conserved carboxy-terminal domain (CTD)-interacting protein.
Larochelle M, Hunyadkürti J, Bachand F. Larochelle M, et al. Curr Genet. 2017 May;63(2):195-199. doi: 10.1007/s00294-016-0645-8. Epub 2016 Aug 31. Curr Genet. 2017. PMID: 27582274 Review.
Cited by
- PCB126 Exposure Revealed Alterations in m6A RNA Modifications in Transcripts Associated With AHR Activation.
Aluru N, Karchner SI. Aluru N, et al. Toxicol Sci. 2021 Jan 6;179(1):84-94. doi: 10.1093/toxsci/kfaa158. Toxicol Sci. 2021. PMID: 33064826 Free PMC article. - Mechanisms of RNA N6-Methyladenosine in Hepatocellular Carcinoma: From the Perspectives of Etiology.
Lu J, Qian J, Yin S, Zhou L, Zheng S, Zhang W. Lu J, et al. Front Oncol. 2020 Jul 7;10:1105. doi: 10.3389/fonc.2020.01105. eCollection 2020. Front Oncol. 2020. PMID: 32733807 Free PMC article. Review. - METTL3 drives telomere targeting of TERRA lncRNA through m6A-dependent R-loop formation: a therapeutic target for ALT-positive neuroblastoma.
Vaid R, Thombare K, Mendez A, Burgos-Panadero R, Djos A, Jachimowicz D, Lundberg KI, Bartenhagen C, Kumar N, Tümmler C, Sihlbom C, Fransson S, Johnsen JI, Kogner P, Martinsson T, Fischer M, Mondal T. Vaid R, et al. Nucleic Acids Res. 2024 Mar 21;52(5):2648-2671. doi: 10.1093/nar/gkad1242. Nucleic Acids Res. 2024. PMID: 38180812 Free PMC article. - Alternative splicing and related RNA binding proteins in human health and disease.
Tao Y, Zhang Q, Wang H, Yang X, Mu H. Tao Y, et al. Signal Transduct Target Ther. 2024 Feb 2;9(1):26. doi: 10.1038/s41392-024-01734-2. Signal Transduct Target Ther. 2024. PMID: 38302461 Free PMC article. Review. - Insight into m6A methylation from occurrence to functions.
Ru W, Zhang X, Yue B, Qi A, Shen X, Huang Y, Lan X, Lei C, Chen H. Ru W, et al. Open Biol. 2020 Sep;10(9):200091. doi: 10.1098/rsob.200091. Epub 2020 Sep 9. Open Biol. 2020. PMID: 32898471 Free PMC article. Review.
References
Publication types
MeSH terms
Substances
Grants and funding
- F30 GM120917/GM/NIGMS NIH HHS/United States
- R01 GM113194/GM/NIGMS NIH HHS/United States
- RM1 HG008935/HG/NHGRI NIH HHS/United States
- T32 GM007281/GM/NIGMS NIH HHS/United States
LinkOut - more resources
Full Text Sources
Other Literature Sources
Molecular Biology Databases


