Lipid Profiling Reveals Browning Heterogeneity of White Adipose Tissue by Β3-Adrenergic Stimulation - PubMed (original) (raw)
doi: 10.3390/biom9090444.
Biyu Hou 1, Yanliang Li 2, Chunyang Xu 1, Peng Ma 1, Sin Man Lam 3, Victoria Gil 2, Xinyu Yang 4, Xiuying Yang 1, Li Zhang 1, Guanghou Shui 3, Junke Song 1, Guifen Qiang 5, Chong Wee Liew 6, Guanhua Du 7
Affiliations
- PMID: 31484405
- PMCID: PMC6770315
- DOI: 10.3390/biom9090444
Lipid Profiling Reveals Browning Heterogeneity of White Adipose Tissue by Β3-Adrenergic Stimulation
Ping He et al. Biomolecules. 2019.
Abstract
Background: White adipose tissue (WAT) browning confers beneficial effects on metabolic diseases. However, visceral adipose tissue (VAT) is not as susceptible to browning as subcutaneous adipose tissue (SAT).
Aim: Interpreting the heterogeneity of VAT and SAT in brown remodeling and provide promising lipid targets to promote WAT browning.
Methods: We first investigated the effects of β3-adrenergic stimulation by CL316,243 on systemic metabolism. Then, high-coverage targeted lipidomics approach with multiple reaction monitoring (MRM) was utilized to provide extensive detection of lipid metabolites in VAT and SAT.
Results: CL316,243 notably ameliorated the systemic metabolism and induced brown remodeling of SAT but browning resistance of VAT. Comprehensive lipidomics analysis revealed browning heterogeneity of VAT and SAT with more dramatic alteration of lipid classes and species in VAT rather than SAT, though VAT is resistant to browning. Adrenergic stimulation differentially affected glycerides content in VAT and SAT and boosted the abundance of more glycerophospholipids species in VAT than in SAT. Besides, CL316,243 increased sphingolipids in VAT without changes in SAT, meanwhile, elevated cardiolipin species more prominently in VAT than in SAT.
Conclusions: We demonstrated the browning heterogeneity of WAT and identified potential lipid biomarkers which may provide lipid targets for overcoming VAT browning resistance.
Keywords: browning heterogeneity; lipid profiling; subcutaneous adipose tissue; visceral adipose tissue; white adipose tissue.
Conflict of interest statement
The authors declare no conflict of interest.
Figures
Figure 1
A schematic diagram of experimental design.
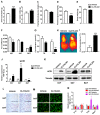
Figure 2
Adrenergic stimulation-induced browning heterogeneity of white adipose tissue and ameliorated systemic metabolism. C57BL/6J mice were injected intraperitoneally with CL316,243 at the dose of 1 mg/kg/d for 10 days and the general parameters were measured (n = 5). (A) 24-h food intake; (B) 24-h water intake; (C) Fasting blood glucose; (D) Fed blood glucose; (E) Body weight; (F) Fat coefficient of visceral adipose tissue (VAT), subcutaneous adipose tissue (SAT), and brown adipose tissue (BAT) in vehicle and CL316,243-injected mice; (G) The concentration of blood triglyceride (TG) and free fatty acids (FFA); (H) The shell temperature was spotted by a thermal imaging camera purchased from FLIR when mice were under anesthesia and (I) the temperature was analyzed using FLIR tools. All data are presented as mean ± SEM. ** P < 0.01; *** P < 0.001 compared with Vehicle group; (J) qPCR and (K) immunoblotting analysis of UCP1 expression in VAT, SAT, and BAT of mice injected with CL316,243. qPCR data are normalized to TATA box-binding protein (TBP) and presented as mean ± SEM, n = 5. * P < 0.05; ** P < 0.01 compared with Vehicle group; (L) H&E staining and (M) immunohistochemistry staining of UCP1 in VAT and SAT of mice injected with CL316,243. Scale bar = 200 μm. (N) qPCR analysis of interleukin-1 beta (Il-1b), interleukin-6 (Il-6), tumor necrosis factor alpha (Tnfa), and monocyte chemoattractant protein 1 (Mcp1) in VAT and SAT of mice injected with CL316,243. qPCR data are normalized to TBP and presented as mean ± SEM, n = 5.
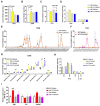
Figure 3
Total composition of lipid classes in VAT and SAT altered in response to CL316,243 treatment. (A) Score plot of a multivariate principal component analysis (PCA) of the lipids composition of VAT and SAT from CL316,243-treated C57BL/6J mice; (B) Heatmap visualization of the abundance of 17 lipid classes in VAT and SAT from CL316,243-injected mice. In total, 334 lipid species were quantified, and (C) 160 molecular species were significantly changed in VAT, while (D) 56 molecular species were dramatically altered in SAT.
Figure 4
Exposure to CL316,243 differentially affected the abundance of glycerides in VAT and SAT. The total abundance of (A) triacylglycerol (TAG), (B) diacylglycerol (DAG), (C) free fatty acids (FFA), (D) cholesterol (Cho), and cholesteryl ester (CE) were detected. The concentration of significantly changed TAG molecular species in (E) VAT and (F) SAT of mice after CL316,243 injection. The dotted lines separate the raised and lowered species; (G) The amount of significantly altered DAG subclasses in VAT and SAT from vehicle and CL316,243-treated mice; (H) The abundance of dramatically changed molecular species of FFA and CE in VAT and SAT of mice after CL316,243 treatment. Data are presented as mean ± SEM, n = 5. * P<0.05; ** P < 0.01 compared with VAT Vehicle group. # P < 0.05; ## P < 0.01 compared with SAT Vehicle group. (I) qPCR analysis of adipose triglyceride lipase (Atgl), hormone-sensitive lipase (Hsl), and sterol regulatory element-binding protein 1 (Srebp1) gene expression in VAT and SAT of mice injected with CL316,243. qPCR data are normalized to TBP and presented as mean ± SEM, n = 5. *** P < 0.001 compared with VAT Vehicle group.
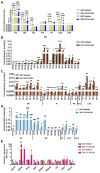
Figure 5
Adrenergic stimulation boosted the abundance of more glycerophospholipids species in VAT than in SAT. (A) The overall concentration of classical glycerophospholipids was determined. The abundance of significantly varied (B) phosphatidylcholine (PC), and (C) phosphatidylethanolamine (PE), phosphatidylinositol (PI), phosphatidic acid (PA), phosphatidylserines (PS), lyso-PC (LPC) species in VAT; (D) The obviously changed molecular species of PC, PE, PI, LPC, and lyso-PS (LPS) in SAT. Data are presented as mean ± SEM, n = 5. * P < 0.05; ** P < 0.01; *** P < 0.001 compared with VAT Vehicle group. # P < 0.05; ## P < 0.01; ### P < 0.001 compared with SAT Vehicle group. (E) qPCR analysis of carnitine palmitoyltransferase 1a (Cpt1a), carnitine palmitoyltransferase 1b (Cpt1b), phosphatidylserine decarboxylase (Pisd), phospholipase D1 (Pld1), phosphatidylserine synthase 1 (Ptdss1), phosphatidylserine synthase 2 (Ptdss2), phosphatidylinositol synthase (Pis), CDP-diacylglycerol synthase 1 (Cds1), and phospholipase A1 member A (Pla1a) gene expression in VAT and SAT of mice injected with CL316,243. qPCR data are normalized to TBP and presented as mean ± SEM, n = 5. ** P < 0.01 compared with VAT Vehicle group. # P < 0.05 compared with SAT Vehicle group.
Figure 6
CL316,243 increased sphingolipids in VAT without changes in SAT. (A) The total concentration of sphingolipids in VAT and SAT were quantified. Concentration of (B) ceramide (Cer), (C) glucosylceramide (GluCer), galactosylceramide (GalCer), and (D) sphingomyelin (SM) species significantly changed in VAT after 10 days of CL316,243 injection; (E) The molecular species of GluCer and SM changed in VAT by CL316,243. All data are presented as mean ± SEM, n = 5. * P < 0.05; ** P < 0.01; *** P < 0.001 compared with VAT Vehicle group. ## P < 0.01 compared with SAT Vehicle group. (F) qPCR analysis of ceramide synthase 2 (Cers2), serine palmitoyltransferase long chain base subunit 1 (Sptlc1), serine palmitoyltransferase long chain base subunit 2 (Sptlc2), serine palmitoyltransferase small subunit A (Sptssa) and serine palmitoyltransferase small subunit B (Sptssb) gene expression in VAT and SAT of mice injected with CL316,243. qPCR data are normalized to TBP and presented as mean ± SEM, n = 5. * P < 0.05 compared with VAT Vehicle group. # P < 0.05 compared with SAT Vehicle group.
Figure 7
Cardiolipin was elevated by CL316,243 in both VAT and SAT. (A) The total content of cardiolipin was significantly altered in both VAT and SAT in response to CL316,243 treatment. In 35 species detected, (B) 27 molecular species were obviously changed in VAT, and 15 species were greatly altered in SAT. Dramatically changed particular species of cardiolipin are illustrated as circles. Size of circle indicates level of significance. All data are presented as mean ± SEM, n = 5. *** P < 0.001 compared with VAT Vehicle group. # P < 0.05 compared with SAT Vehicle group. (C) qPCR analysis of cardiolipin synthase 1 (Crls1) gene expression in VAT and SAT of mice injected with CL316,243. qPCR data are normalized to TBP and presented as mean ± SEM, _n_=5. ** P < 0.01 compared with VAT Vehicle group.
Similar articles
- Targeted lipidomics and transcriptomics profiling reveal the heterogeneity of visceral and subcutaneous white adipose tissue.
Hou B, Zhao Y, He P, Xu C, Ma P, Lam SM, Li B, Gil V, Shui G, Qiang G, Liew CW, Du G. Hou B, et al. Life Sci. 2020 Mar 15;245:117352. doi: 10.1016/j.lfs.2020.117352. Epub 2020 Jan 29. Life Sci. 2020. PMID: 32006527 Free PMC article. - 18F-FDG PET/CT monitoring of β3 agonist-stimulated brown adipocyte recruitment in white adipose tissue.
Park JW, Jung KH, Lee JH, Quach CH, Moon SH, Cho YS, Lee KH. Park JW, et al. J Nucl Med. 2015 Jan;56(1):153-8. doi: 10.2967/jnumed.114.147603. Epub 2014 Dec 18. J Nucl Med. 2015. PMID: 25525187 - Aging and β3-adrenergic stimulation alter mitochondrial lipidome of adipose tissue.
Rajakumari S, Srivastava S. Rajakumari S, et al. Biochim Biophys Acta Mol Cell Biol Lipids. 2021 Jul;1866(7):158922. doi: 10.1016/j.bbalip.2021.158922. Epub 2021 Mar 11. Biochim Biophys Acta Mol Cell Biol Lipids. 2021. PMID: 33713833 - Energy metabolism of white adipose tissue and insulin resistance in humans.
Bódis K, Roden M. Bódis K, et al. Eur J Clin Invest. 2018 Nov;48(11):e13017. doi: 10.1111/eci.13017. Epub 2018 Sep 26. Eur J Clin Invest. 2018. PMID: 30107041 Review. - Two Faces of White Adipose Tissue with Heterogeneous Adipogenic Progenitors.
Hwang I, Kim JB. Hwang I, et al. Diabetes Metab J. 2019 Dec;43(6):752-762. doi: 10.4093/dmj.2019.0174. Diabetes Metab J. 2019. PMID: 31902145 Free PMC article. Review.
Cited by
- Improved Therapeutic Efficiency against Obesity through Transdermal Drug Delivery Using Microneedle Arrays.
Xie Y, Shao R, Lin Y, Wang C, Tan Y, Xie W, Sun S. Xie Y, et al. Pharmaceutics. 2021 Jun 2;13(6):827. doi: 10.3390/pharmaceutics13060827. Pharmaceutics. 2021. PMID: 34199630 Free PMC article. - Allosteric regulation of thioesterase superfamily member 1 by lipid sensor domain binding fatty acids and lysophosphatidylcholine.
Tillman MC, Imai N, Li Y, Khadka M, Okafor CD, Juneja P, Adhiyaman A, Hagen SJ, Cohen DE, Ortlund EA. Tillman MC, et al. Proc Natl Acad Sci U S A. 2020 Sep 8;117(36):22080-22089. doi: 10.1073/pnas.2003877117. Epub 2020 Aug 20. Proc Natl Acad Sci U S A. 2020. PMID: 32820071 Free PMC article. - Metabolomic Analysis Reveals Changes in Plasma Metabolites in Response to Acute Cold Stress and Their Relationships to Metabolic Health in Cold-Acclimatized Humans.
Kovaničová Z, Karhánek M, Kurdiová T, Baláž M, Wolfrum C, Ukropcová B, Ukropec J. Kovaničová Z, et al. Metabolites. 2021 Sep 12;11(9):619. doi: 10.3390/metabo11090619. Metabolites. 2021. PMID: 34564435 Free PMC article. - Depot-specific adaption of adipose tissue for different exercise approaches in high-fat diet/streptozocin-induced diabetic mice.
Guo Y, Zhang Q, Zheng L, Shou J, Zhuang S, Xiao W, Chen P. Guo Y, et al. Front Physiol. 2023 Jul 6;14:1189528. doi: 10.3389/fphys.2023.1189528. eCollection 2023. Front Physiol. 2023. PMID: 37485056 Free PMC article. - The Beneficial Effects of Essential Oils in Anti-Obesity Treatment.
De Blasio A, D'Anneo A, Lauricella M, Emanuele S, Giuliano M, Pratelli G, Calvaruso G, Carlisi D. De Blasio A, et al. Int J Mol Sci. 2021 Oct 31;22(21):11832. doi: 10.3390/ijms222111832. Int J Mol Sci. 2021. PMID: 34769261 Free PMC article. Review.
References
- Ibrahim M.M. Subcutaneous and visceral adipose tissue: Structural and functional differences. Obes. Metab. 2010;11:11–18. - PubMed
- Hamdy O., Porramatikul S., Al-Ozairi E. Metabolic obesity: The paradox between visceral and subcutaneous fat. Curr. Diabetes Rev. 2006;2:367–373. - PubMed
- Snijder M.B., Dekker J.M., Visser M., Bouter L.M., Stehouwer C.D., Kostense P.J., Yudkin J.S., Heine R.J., Nijpels G., Seidell J.C. Associations of hip and thigh circumferences independent of waist circumference with the incidence of type 2 diabetes: The Hoorn Study. Am. J. Clin. Nutr. 2003;77:1192–1197. - PubMed
Publication types
MeSH terms
Substances
LinkOut - more resources
Full Text Sources
Research Materials


