Replication stress induces mitotic death through parallel pathways regulated by WAPL and telomere deprotection - PubMed (original) (raw)
Replication stress induces mitotic death through parallel pathways regulated by WAPL and telomere deprotection
V Pragathi Masamsetti et al. Nat Commun. 2019.
Abstract
Mitotic catastrophe is a broad descriptor encompassing unclear mechanisms of cell death. Here we investigate replication stress-driven mitotic catastrophe in human cells and identify that replication stress principally induces mitotic death signalled through two independent pathways. In p53-compromised cells we find that lethal replication stress confers WAPL-dependent centromere cohesion defects that maintain spindle assembly checkpoint-dependent mitotic arrest in the same cell cycle. Mitotic arrest then drives cohesion fatigue and triggers mitotic death through a primary pathway of BAX/BAK-dependent apoptosis. Simultaneously, a secondary mitotic death pathway is engaged through non-canonical telomere deprotection, regulated by TRF2, Aurora B and ATM. Additionally, we find that suppressing mitotic death in replication stressed cells results in distinct cellular outcomes depending upon how cell death is averted. These data demonstrate how replication stress-induced mitotic catastrophe signals cell death with implications for cancer treatment and cancer genome evolution.
Conflict of interest statement
The authors declare no competing interests.
Figures
Fig. 1
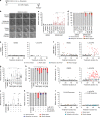
Replication stress induces mitotic arrest and mitotic death. a Time course of live cell imaging throughout this study unless indicated otherwise. b Representative images depicting mitotic outcome and duration from DIC live cell imaging experiments. Time is shown as (hours: minutes) relative to the first image of the series. Scale bar represents 10 µm. c Mitotic duration of IMR90 or IMR90 E6E7 cells following treatment with Dimethyl sulfoxide (DMSO) vehicle, Aphidicolin (APH), or Hydroxyurea (HU) (three biological replicates scoring n ≥ 46 mitoses per condition for IMR90 or n ≥ 66 mitoses per condition for IMR90 E6E7 are compiled in a Tukey box plot, Mann–Whitney test). d Outcome of the mitotic events in (c) (mean ± s.e.m, n = 3 biological replicates, Fisher’s Exact Test). e, f Two-dimensional dot plots for IMR90 (e) and IMR90 E6E7 (f) of mitotic duration and outcome for the data shown in (c, d). Each symbol represents an individual mitosis. T = 0 h is when DMSO or APH were added to the culture. Location of a symbol on the x-axis indicates the time after treatment when that mitosis initiated, the height on the y-axis represents mitotic duration, and the symbol corresponds to mitotic outcome. g Mitotic duration of HT1080 6TG cells following treatment with DMSO, APH, or HU (three biological replicates scoring n ≥ 92 mitotic events per condition compiled in a Tukey box plot, Mann–Whitney test). h Outcome of the mitotic events in (g) (mean ± s.e.m, n = 3 biological replicates, Fisher’s Exact Test). i Two-dimensional dot plots of mitotic duration and outcome from (g, h). j Mitotic duration of HT1080 6TG cultures treated with DMSO, APH or HU ± reversine (REV) (three biological replicates scoring ≥ 112 mitotic events per each condition compiled in a Tukey box plot, Mann–Whitney test). k Outcome of mitotic events in (j) (mean ± s.e.m., n = 3 biological replicates, Fisher’s Exact Test). l Two-dimensional plots of mitotic duration and outcome from (j, k). For all panels, *p < 0.05_,_ **p < 0.01. Source data are provided as a Source Data file
Fig. 2
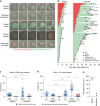
Replication stress induces mitotic death in the same cell cycle. a Representative images from live cell microscopy of HT1080 6TG-FUCCI cells. Time is shown as (h:min) relative to the first image of the series. Scale bars represent 10 µm. b Cell fate map of HT1080 6TG-FUCCI live cell imaging. Each bar represents an individual cell as it progresses through the first cell cycle to cell division or death, relative to addition of DMSO (n = 127) or APH (n = 148) to the growth media at T = 0. Segment length represents the duration a cell spent in each cell cycle phase. Cell cycle phases are colour coded according to FUCCI and shown in the legend. Data are from two independent biological replicates compiled into a single graph. c, d Cell cycle phase duration and outcome for HT1080 6TG-FUCCI live cell imaging shown in (b). Data are sorted based on cells that were in S/G2 (c) or G1 (d) at the time the DMSO or APH was administered. Symbols indicate if a cell survived that cell cycle phase and progressed, or if the cell died during that cell cycle phase. Data are from two independent biological replicates, compiled into a dot plot (Mann–Whitney test, **p < 0.01, ns = not significant). e Categorization of all cell death events from (b) in the first cell cycle with APH treatment (n = 2 replicates, line represents the mean). Source data are provided as a Source Data file
Fig. 3
Replication stress induces distinct types of mitotic death. a Mitotic duration of HeLa parental and BAX BAK DKO cells following treatment with DMSO or APH (three biological replicates using independent clones scoring n ≥ 32 mitotic events per condition are compiled in a Tukey box plot, Mann–Whitney test, **p < 0.01, ns = not significant). b Two-dimensional dot plots of mitotic duration and outcome in 0.75 µM APH treated HeLa parental and BAX BAK DKO cells from (a). The dashed line identifies the longest duration mitosis observed in the parental cells. c Outcome of the mitotic events in (a) (mean ± s.e.m., n = 3 biological replicates using independent clones, Fisher’s Exact Test, **p < 0.01, ns = not significant). d Representative images of Type 1 and Type 2 mitotic death in 1 µM APH treated HT1080 6TG H2B-mCherry cells. Time is shown as (h:min) relative to the first image of the series. Scale bar represents 10 µm. e Quantitation of cell death events in 0.75 and 1.0 µM APH treated HT1080 6TG H2B-mCherry cultures (mean ± s.d., n = 3 biological replicates scoring ≥57 mitotic events per condition for 0.75 µM APH and n = 4 biological replicates scoring ≥91 mitotic events per condition for 1.0 µM APH). Source data are provided as a Source Data file
Fig. 4
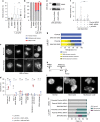
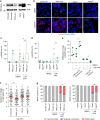
Replication stress induces WAPL-dependent cohesion fatigue. a Time course for experimentation in (b, c). b Representative images of cytogenetic chromosome spreads depicting the replication stress-induced cohesion phenotypes from HT1080 6TG cells stained with DAPI (blue), centromere (red) and telomere (green) FISH. c Quantitation of cohesion phenotypes depicted in (b) in HT1080 6TG cells treated with DMSO or APH, ± reversine (REV), colcemid or Taxol (mean ± s.e.m., n = 3 biological replicates scoring ≥ 152 chromosome spreads per condition, Fisher’s Exact Test). d Experimental time course for (e–g). e Western blots of whole cell extracts from HT1080 6TG cells treated with WAPL or control siRNA. f Representative images of cytogenetic chromosome spreads from HT1080 6TG cells treated with APH and siRNA. g Quantitation of cohesion phenotypes in HT1080 6TG cells treated with APH ± siRNA (mean ± s.e.m., n = 3 biological replicates scoring ≥ 144 chromosome spreads per condition, Fisher’s Exact Test). For all panels **p < 0.01. Scale bars represent 10 µm. Source data are provided as a Source Data file
Fig. 5
Type 1 mitotic death is WAPL and BAX/BAK dependent. a Mitotic duration of HT1080 6TG cells treated with APH ± siRNA (three biological replicates scoring n ≥ 429 mitoses per condition are compiled in a Tukey box plot, Mann–Whitney test). b) Outcome of the mitotic events in (a) (mean ± s.e.m., n = 3 biological replicates, Fisher’s Exact Test). c Representative images of cell division generating micronuclei, or mitotic slippage, in APH treated HT1080 6TG H2B-mCherry cells. Time is shown as (h:min) relative to the first image in the series. d Mitotic outcomes in HT1080 6TG H2B-mCherry cells treated with APH ± WAPL siRNA or BAX BAK DKO (three biological replicates scoring n = 97 APH, n = 38 APH + WAPL knock down, n = 88 APH + BAX BAK DKO cells, Student t-test or Fisher’s Exact test). e Western blots of whole cell extracts from HT1080 6TG BAX BAK DKO cells treated with WAPL or control siRNA. f Mitotic duration of HT1080 6TG BAX BAK DKO cells treated with APH ± siRNA (three biological replicates scoring n ≥ 86 mitoses per condition are compiled in a Tukey box plot, Mann–Whitney test). g Quantitation of cohesion phenotypes as depicted in Fig. 4b in HT1080 6TG BAX BAK DKO cells treated with DMSO or APH (mean ± s.e.m, n = 3 biological replicates scoring ≥ 50 chromosome spreads per condition, Fisher’s Exact Test). h Timeline of the experiment shown in (i, j). i Images of DAPI stained nuclei depicting the indicated nuclear phenotypes. j Quantitation of the phenotypes shown in (i) from HT1080 6TG cells and derivatives at the 72-hour time point as indicated in (h) (n = 3 biological replicates scoring 100 nuclei per replicate, mean ± s.e.m, Fisher’s exact test). For all panels ns = not significant, **p < 0.01. Scale bars represent 10 µm. Source data are provided as a Source Data file
Fig. 6
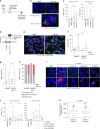
Replication stress induces mitotic telomere deprotection. a Experimental time course for (b, c). b Example images of cytocentrifuged chromosome spreads from HT1080 6TG cells treated with DMSO or APH and stained with DAPI (blue), γ-H2AX immunofluorescence (red) and telomere FISH (green). c Quantitation of mitotic telomeric and genomic DDR foci in APH or HU treated HT1080 6TG cells (three biological replicates scoring n ≥ 81 chromosome spreads per condition are compiled in a Tukey box plot, Mann–Whitney test). d Western blot of whole cell extracts from HT1080 6TG parental and HT1080 6TG mCherry-TRF1OE cells. e Representative images of cytocentrifuged chromosomes from HT1080 6TG mCherry-TRF1OE cells treated with DMSO or APH, stained with DAPI (blue) and γ-H2AX IF (green). f Quantitation of mitotic telomeric DDR foci in HT1080 6TG parental and HT1080 6TG mCherry-TRF1OE cells (two biological replicates scoring n ≥ 48 chromosome spreads per condition are compiled in a Tukey box plot, Mann–Whitney test). g Mitotic duration of HT1080 6TG parental and HT1080 6TG mCherry-TRF1OE cells with DMSO or APH treatment (three biological replicates scoring n ≥ 57 mitoses per condition compiled in a Tukey box plot, Mann–Whitney test). h Outcome of the mitotic events in (g) (mean ± s.e.m., n = 3 biological replicates, Fisher’s Exact Test). i Representative images of the mitotic DDR on cytocentrifuged chromosome as shown in (b) for HT1080 6TG cells treated with APH ± reversine, Hesperadin or KU-55933. j Quantitation of mitotic telomere and genomic DDR foci for the conditions shown in (i) (three biological replicates scoring n ≥ 37 chromosome spreads per condition are compiled in a Tukey box plot, Mann–Whitney test). k Telomere PNA FISH signal intensity in arbitrary units (A.U.) from individual telomeres in APH treated HT1080 6TG cells, sorted by γ-H2AX status (three biological replicates scoring n ≥ 1529 telomeres per condition compiled into a Tukey box plot, Mann–Whitney test). For all panels, ns = not significant, **p < 0.01. Scale bars represent 10 µm. Source data are provided as a Source Data file
Fig. 7
Telomere deprotection contributes to replication stress lethality. a Western blots of whole cell extracts from HT1080 6TG cells stably transduced with control, TRF2 shRNA (TRF sh-F) or TRF2 over expression (TRF2OE) vectors. b Representative images of cyto-centrifuged chromosome spreads stained with DAPI (blue), γ-H2AX IF (red) and telomere PNA (green) from control, TRF sh-F or TRF2OE HT1080 6TG cells treated with DMSO or APH. Scale bar represents 10 µm. c, d Quantitation of mitotic telomere DDR foci from Control sh and TRF2 sh-F cells (c) or vector and TRF2OE cells (d) ± DMSO or APH (three biological replicates scoring n = 50 mitotic spreads per replicate compiled in a Tukey box plot, Mann–Whitney test). e Difference in the mean number of mitotic telomeric γ-H2AX foci between HT1080 6TG TRF2 sh-F or TRF2OE cells and their appropriate vector control. These are a different representation of the same data shown in (c, d) (mean ± s.e.m., n = 3 three biological replications, Student’s _t_-test). f Mitotic duration to cell death in APH treated control, TRF2 sh-F and or TRF2OE cells (three biological replicates scoring ≥267 mitotic death events per condition are shown in a dot plot, mean ± s.e.m., Mann–Whitney test). g Mitotic outcome of control, TRF2 sh-F and TRF2OE cells treated with APH or DMSO (mean ± s.e.m., n = 3 biological replicates of at least 267 mitoses per condition, Fisher’s Exact Test). For all panels, *p < 0.05, **p < 0.01. Source data are provided as a Source Data file
Fig. 8
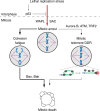
Model of replication stress-induced mitotic death. In p53-competent cells replication stress prevents mitotic entry, while lethal replication stress induces SAC-dependent mitotic arrest in cells lacking p53 function. With lethal replication stress WAPL promotes mitotic arrest which drives a dominant pathway of cell death through cohesion fatigue and BAX/BAK apoptosis. Non-canonical mitotic telomere deprotection contributes to a minority of mitotic lethality
Similar articles
- Combretastatin-A4 prodrug induces mitotic catastrophe in chronic lymphocytic leukemia cell line independent of caspase activation and poly(ADP-ribose) polymerase cleavage.
Nabha SM, Mohammad RM, Dandashi MH, Coupaye-Gerard B, Aboukameel A, Pettit GR, Al-Katib AM. Nabha SM, et al. Clin Cancer Res. 2002 Aug;8(8):2735-41. Clin Cancer Res. 2002. PMID: 12171907 - Cell death during crisis is mediated by mitotic telomere deprotection.
Hayashi MT, Cesare AJ, Rivera T, Karlseder J. Hayashi MT, et al. Nature. 2015 Jun 25;522(7557):492-6. doi: 10.1038/nature14513. Nature. 2015. PMID: 26108857 Free PMC article. - Expression of Bcl-xL and loss of p53 can cooperate to overcome a cell cycle checkpoint induced by mitotic spindle damage.
Minn AJ, Boise LH, Thompson CB. Minn AJ, et al. Genes Dev. 1996 Oct 15;10(20):2621-31. doi: 10.1101/gad.10.20.2621. Genes Dev. 1996. PMID: 8895663 - Cell death by mitotic catastrophe: a molecular definition.
Castedo M, Perfettini JL, Roumier T, Andreau K, Medema R, Kroemer G. Castedo M, et al. Oncogene. 2004 Apr 12;23(16):2825-37. doi: 10.1038/sj.onc.1207528. Oncogene. 2004. PMID: 15077146 Review. - BCL-2 proteins and apoptosis: Recent insights and unknowns.
Edlich F. Edlich F. Biochem Biophys Res Commun. 2018 May 27;500(1):26-34. doi: 10.1016/j.bbrc.2017.06.190. Epub 2017 Jul 1. Biochem Biophys Res Commun. 2018. PMID: 28676391 Review.
Cited by
- Tipping Cancer Cells Over the Edge: The Context-Dependent Cost of High Ploidy.
Andor N, Altrock PM, Jain N, Gomes AP. Andor N, et al. Cancer Res. 2022 Mar 1;82(5):741-748. doi: 10.1158/0008-5472.CAN-21-2794. Cancer Res. 2022. PMID: 34785577 Free PMC article. - Chemical Synthesis of the PAX Protein Inhibitor EG1 and Its Ability to Slow the Growth of Human Colorectal Carcinoma Cells.
McDougall L, Kueh JTB, Ward J, Tyndall JDA, Woolley AG, Mehta S, Stayner C, Larsen DS, Eccles MR. McDougall L, et al. Front Oncol. 2021 Oct 13;11:709540. doi: 10.3389/fonc.2021.709540. eCollection 2021. Front Oncol. 2021. PMID: 34722257 Free PMC article. - Kinetics of DNA Repair in Vicia faba Meristem Regeneration Following Replication Stress.
Rybaczek D, Musiałek MW, Vrána J, Petrovská B, Pikus EG, Doležel J. Rybaczek D, et al. Cells. 2021 Jan 7;10(1):88. doi: 10.3390/cells10010088. Cells. 2021. PMID: 33430297 Free PMC article. - Dual Targeting of Chromatin Stability By The Curaxin CBL0137 and Histone Deacetylase Inhibitor Panobinostat Shows Significant Preclinical Efficacy in Neuroblastoma.
Xiao L, Somers K, Murray J, Pandher R, Karsa M, Ronca E, Bongers A, Terry R, Ehteda A, Gamble LD, Issaeva N, Leonova KI, O'Connor A, Mayoh C, Venkat P, Quek H, Brand J, Kusuma FK, Pettitt JA, Mosmann E, Kearns A, Eden G, Alfred S, Allan S, Zhai L, Kamili A, Gifford AJ, Carter DR, Henderson MJ, Fletcher JI, Marshall G, Johnstone RW, Cesare AJ, Ziegler DS, Gudkov AV, Gurova KV, Norris MD, Haber M. Xiao L, et al. Clin Cancer Res. 2021 Aug 1;27(15):4338-4352. doi: 10.1158/1078-0432.CCR-20-2357. Epub 2021 May 16. Clin Cancer Res. 2021. PMID: 33994371 Free PMC article. - Mind the replication gap.
Mocanu C, Chan KL. Mocanu C, et al. R Soc Open Sci. 2021 Jun 9;8(6):201932. doi: 10.1098/rsos.201932. R Soc Open Sci. 2021. PMID: 34113447 Free PMC article. Review.
References
Publication types
MeSH terms
Substances
LinkOut - more resources
Full Text Sources
Research Materials
Miscellaneous
