Genetic determinants of cellular addiction to DNA polymerase theta - PubMed (original) (raw)
. 2019 Sep 19;10(1):4286.
doi: 10.1038/s41467-019-12234-1.
Dennis A Simpson 1, Juan Carvajal-Garcia 1, Brandon A Price 1, Rashmi J Kumar 1, Lisle E Mose 1, Richard D Wood 2, Naim Rashid 1 3, Jeremy E Purvis 4, Joel S Parker 1 4, Dale A Ramsden 1 5, Gaorav P Gupta 6 7 8
Affiliations
- PMID: 31537809
- PMCID: PMC6753077
- DOI: 10.1038/s41467-019-12234-1
Genetic determinants of cellular addiction to DNA polymerase theta
Wanjuan Feng et al. Nat Commun. 2019.
Abstract
Polymerase theta (Pol θ, gene name Polq) is a widely conserved DNA polymerase that mediates a microhomology-mediated, error-prone, double strand break (DSB) repair pathway, referred to as Theta Mediated End Joining (TMEJ). Cells with homologous recombination deficiency are reliant on TMEJ for DSB repair. It is unknown whether deficiencies in other components of the DNA damage response (DDR) also result in Pol θ addiction. Here we use a CRISPR genetic screen to uncover 140 Polq synthetic lethal (PolqSL) genes, the majority of which were previously unknown. Functional analyses indicate that Pol θ/TMEJ addiction is associated with increased levels of replication-associated DSBs, regardless of the initial source of damage. We further demonstrate that approximately 30% of TCGA breast cancers have genetic alterations in PolqSL genes and exhibit genomic scars of Pol θ/TMEJ hyperactivity, thereby substantially expanding the subset of human cancers for which Pol θ inhibition represents a promising therapeutic strategy.
Conflict of interest statement
The authors declare no competing interests.
Figures
Fig. 1
Identification of Polq synthetic lethal (PolqSL) genes by CRISPR screening. a Schematic of the CRISPR genetic screen to identify PolqSL genes. b Violin plot of Gene Abundance Change Scores (Log2) for DDR gene-targeting sgRNAs (red) and non-targeting control sgRNAs (blue) in Polq −/− and Polq hPOLQ MEFs, relative to WT MEFs. c Volcano plot of Gene Abundance Change Scores (Polq −/− versus Polq hPOLQ) and -Log10 p-value of the Kolmogorov-Smirnov test for DDR gene-targeting sgRNAs relative to non-targeting control sgRNAs. Thresholds for statistical significance are indicated by dashed lines (see “Methods” for details). Genes with statistically significant (Blue dots) and non-significant (Gray dots) Gene Abundance Changes Scores are indicated. Genes with red/purple triangles are further validated in Fig. 1d. d Relative cell survival measured by colony forming efficiency of WT or Polq −/− cells transduced with a lentivirus containing Cas9 and control sgRNA (sgCtrl) or DDR gene-targeting sgRNAs. Data shown are the mean ± SEM (n = 3 biological replicates). Significance determined using an unpaired, two-tailed t-test (*p < 0.05; **p < 0.01; ***p < 0.001, ****p < 0.0001). e Functional classification of PolqSL genes identified in our CRISPR screen depicted as a Euler diagram
Fig. 2
Synthetic lethality of Polq/53bp1 double knockout cells despite HR and NHEJ proficiency. a Schema for marker-free quantification of DSB repair pathway choice at a CRISPR-induced chromosomal break using dPCR. b Quantification of HR, NHEJ, and TMEJ repair at the Rosa26 locus, relative to WT + sgCtrl. Data shown are the mean ± SEM (n = 3 biological replicates). Significance determined using an unpaired, two-tailed _t_-test (*p < 0.05; **p < 0.01; ****p < 0.0001). c Diagram of growth competition assay to assess kinetics of synthetic lethality between Polq and 53bp1. DD-Cas9 is protected from degradation upon exposure to a synthetic ligand (Shield1). Depletion of mVenus-positive cells over time after Shield1 exposure is indicative of sgRNA lethality. d Normalized percentage of mVenus-positive cells over time after Shield1 treatment, measured by flow cytometry. The mean fraction of mVenus-positive cells ± SEM (n = 3) is shown for the various genotypes, normalized to day 0 (no shield). Polq −/− + sg53bp1-1 or -2 ****, p < 0.0001 using two-tailed nonparametric Spearman correlation in GraphPad Prisim v7.04. e–g Time lapse microscopy of PCNA-mCherry to assess cell cycle phase transitions in individual Polq −/− cells 48 h after Shield1 treatment. Cell lines used in this experiment are described in (c) after mVenus sorting. e Image descriptions for the three mitotic outcomes. Mitotic catastrophe is a terminal event with cells undergoing nuclear degradation, and abnormal mitosis refers to cytokinesis failure or chromosomal mis-segregation events resulting in abnormal nuclear structure in subsequent daughter cells. f Distribution of S phase lengths in Polq −/− MEFs transduced with sgCtrl, sg53bp1-1, and sg53bp1-2. **p < 0.01 using a two-tailed _t_-test. g Analysis of mitotic outcome of individual cells with the indicated genotypes. Abnormal mitosis refers to cytokinetic failure or mis-segregation events resulting in abnormal nuclear structure in subsequent daughter cells. Mitotic catastrophe refers to abnormal mitoses resulting in cell death or disappearance. Significance determined using a Chi-square test (**p < 0.01 and ****p < 0.0001)
Fig. 3
Polq/53bp1 double knockout cells accumulate non-productive HR intermediates in S phase. a Representative immunofluorescence (IF) staining of Rad51 (red) and γH2AX (green) foci formation in cells with the indicated genotypes, 48 h after Shield1 treatment. (n = 3 biologically independent experiments). b Quantification of large Rad51 foci per nucleus and percentage of nucleus with Rad51 foci. Data shown are mean ± SEM, and consistent across three independent biological replicates. ***p < 0.001; ****p < 0.0001 using a Mann–Whitney test. c Representative co-IF images for Rad51 (red), γH2AX (green), and EdU (yellow,10 min EdU pulse) in Polq −/− + sg53BP1-2 MEFs to distinguish cell cycle stages as indicated. d Quantification of large Rad51 foci per nucleus stratified by cell cycle stage. *p < 0.05; **p < 0.01; ****p < 0.0001 by a Mann–Whitney test. e Cells were treated with 10 µM Aphidicolin for 4 h followed by release for 0, 6, and 12 h, fixed cells and stained cells with Rad51. Quantification of the percentage of nuclei with Rad51 foci was performed. Data shown are mean ± SEM, and consistent across two independent biological replicates. *p < 0.05; **p < 0.01 using a Mann–Whitney test
Fig. 4
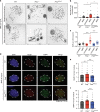
Polq is required for Mitomycin C induced DNA damage repair. a Metaphase aberrations and sister chromatid exchanges are shown in WT, Polq −/− and Polq hPOLQ cells 12 h after treatment with 20 ng/mL Mitomycin C (MMC). Scale bar = 10 µm. b, c Quantification of (a), 35 metaphase spreads for each condition was scored, and shown are mean ± SEM. Significance determined using an unpaired, two-tailed _t_-test (*p < 0.05; ****p < 0.0001). d IF analysis of WT, Polq −/−, and Polq hPOLQ cells six hours after treatment with 20 ng/mL MMC, stained with DAPI (blue) and antibodies specific for Rad51 (red) and 53BP1 (green) (n = 3 biologically independent experiments). (e, f) are quantification of (d). Statistical significance was assessed by unpaired, two-tailed Mann–Whitney tests (***p < 0.001; ****p < 0.0001)
Fig. 5
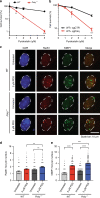
Polq is required for Pyridostatin induced DNA damage repair. a Colony forming efficiency after treatment with Pyridostatin (PDS, 1, 2, 5 µM) in WT and Polq −/− MEFs. b Colony forming efficiency after treatment with Pyridostatin (PDS, 1, 2, 5 µM) in WT MEFs transduced with Cas9 and either sgCtrl or sgPolq (targeting the polymerase domain). a, b Data shown are the mean ± SEM (n = 3). Statistical significance was assessed by two-tailed _t_-tests. *p < 0.05, **p < 0.01 and ***p < 0.001. c IF images for DAPI (blue), Rad51 (red) and 53BP1 (green) in WT and Polq −/− MEFs six hours after treatment with 5 µM PDS (n = 3 biologically independent experiments). d, e are quantification of large Rad51 and 53BP1 foci, as observed in (c). Shown are mean ± SEM, and representative of three independent experimental replicates. Statistical significance was assessed by Mann–Whitney tests. **p < 0.01, ***p < 0.001, and ****p < 0.0001
Fig. 6
Elevated TMEJ repair signatures in cells and cancers with PolqSL gene mutations. a WT, 53bp1 −/−, and Brca2 Mut/− MEFs were transfected with Cas9 ribonucleoprotein (Cas9-RNP) targeting the Rosa26 locus. Forty-eight hours later the targeted region was amplified and analyzed by high throughput sequencing (Illumina MiSeq). b Percentage of repair products classified as NHEJ (≤5 bp del, or 1–3 bp insertion), TMEJ (>5 bp deletion and >2 bp MH), and “Other” (>5 bp deletion and 0–2 bp MH), for the indicated MEF genotypes. c The relative frequency (normalized to WT) of end joining products with >2 bp MH and deletion size within the indicated ranges. 53bp1 −/− MEFs are associated with larger-sized TMEJ signature deletions. b, c Mean values ± SEM (n = 6) are shown. Significance determined using an unpaired, two-tailed _t_-test (*p < 0.05; **p < 0.01; ***p < 0.001). d, e DNA repair products are detected by digital PCR using WT MEFs transduced with the indicated PolqSL gene-targeting sgRNA. HR is detected after co-transfection of a homology donor. Relative rates (normalized to WT + sgCtrl) of (d) homologous recombination (HR) and (e) TMEJ (95 bp deletion with 5 bp MH) are indicated as mean values ± SEM (n = 3). Significance determined using an unpaired, two-tailed _t_-test (***p < 0.001; ****p < 0.0001). f–j Analysis of breast cancers in TCGA. PolqSL mutant breast cancers are identified using cBioPortal as having a truncating mutation or deep copy number deletion. POLQ mRNA expression (f) and COSMIC Signature 3 (g) are elevated in cancers with PolqSL gene alterations. h–j Whole exome sequencing (WES) and whole genome sequencing (WGS) analyses in TCGA breast cancers to detect MH-flanked deletions (MHD). h Breast cancers with PolqSL gene alterations are more likely to have a detectable MHD by WES than breast cancers without alteration in PolqSL genes. The error bar is a bootstrapped 95% confidence interval. WGS data is available for 94 TCGA breast cancers. i High correlation between MHD detected by WGS or WES. j Significantly higher MHD count, detected by WGS, among breast cancers with PolqSL gene alterations, relative to the non-altered breast cancers. f–g, i–j Statistical significance was assessed by two-tailed Mann–Whitney tests. *p < 0.05, **p < 0.01, ***p < 0.001, and ****p < 0.0001
Fig. 7
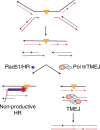
Model for TMEJ in suppressing non-productive HR at replication-associated DNA damage. Orange triangle indicates a replication-obstructing lesion, such as ICL, G4, or base damage, with an associated region of under-replicated DNA. Converging replication forks will generate a two-ended DSB that can undergo end resection to expose 3′ overhangs. Rad51 loading and attempted HR may result in unsuccessful repair due to persistence of the replication blocking lesion in the homologous template DNA. Alternatively, TMEJ is able to perform microhomology-mediated end joining of the exposed 3′ overhangs, without requiring a homologous template
Similar articles
- DNA polymerase θ (POLQ), double-strand break repair, and cancer.
Wood RD, Doublié S. Wood RD, et al. DNA Repair (Amst). 2016 Aug;44:22-32. doi: 10.1016/j.dnarep.2016.05.003. Epub 2016 May 14. DNA Repair (Amst). 2016. PMID: 27264557 Free PMC article. Review. - Mutational signatures of non-homologous and polymerase theta-mediated end-joining in embryonic stem cells.
Schimmel J, Kool H, van Schendel R, Tijsterman M. Schimmel J, et al. EMBO J. 2017 Dec 15;36(24):3634-3649. doi: 10.15252/embj.201796948. Epub 2017 Oct 27. EMBO J. 2017. PMID: 29079701 Free PMC article. - Essential Roles for Polymerase θ-Mediated End Joining in the Repair of Chromosome Breaks.
Wyatt DW, Feng W, Conlin MP, Yousefzadeh MJ, Roberts SA, Mieczkowski P, Wood RD, Gupta GP, Ramsden DA. Wyatt DW, et al. Mol Cell. 2016 Aug 18;63(4):662-673. doi: 10.1016/j.molcel.2016.06.020. Epub 2016 Jul 21. Mol Cell. 2016. PMID: 27453047 Free PMC article. - RETRACTED: Human DNA polymerase θ harbors DNA end-trimming activity critical for DNA repair.
Zahn KE, Jensen RB, Wood RD, Doublié S. Zahn KE, et al. Mol Cell. 2021 Apr 1;81(7):1534-1547.e4. doi: 10.1016/j.molcel.2021.01.021. Epub 2021 Feb 11. Mol Cell. 2021. PMID: 33577776 Free PMC article. Retracted. - Polθ: emerging synthetic lethal partner in homologous recombination-deficient tumors.
Bazan Russo TD, Mujacic C, Di Giovanni E, Vitale MC, Ferrante Bannera C, Randazzo U, Contino S, Bono M, Gristina V, Galvano A, Perez A, Badalamenti G, Russo A, Bazan V, Incorvaia L. Bazan Russo TD, et al. Cancer Gene Ther. 2024 Nov;31(11):1619-1631. doi: 10.1038/s41417-024-00815-2. Epub 2024 Aug 9. Cancer Gene Ther. 2024. PMID: 39122831 Free PMC article. Review.
Cited by
- VGLL3 modulates chemosensitivity through promoting DNA double-strand break repair.
Wu W, Fan Z, Fu H, Ma X, Wang D, Liu H, Zhang C, Zheng H, Yang Y, Wu H, Miao X, An R, Gong Y, Tang TS, Guo C. Wu W, et al. Sci Adv. 2024 Oct 11;10(41):eadr2643. doi: 10.1126/sciadv.adr2643. Epub 2024 Oct 9. Sci Adv. 2024. PMID: 39383226 Free PMC article. - A non-tethering role for the Drosophila Pol θ linker domain in promoting damage resolution.
Blanch JR, Krishnamurthy M, McVey M. Blanch JR, et al. bioRxiv [Preprint]. 2024 Aug 27:2024.08.27.609911. doi: 10.1101/2024.08.27.609911. bioRxiv. 2024. PMID: 39253446 Free PMC article. Preprint. - The DNA polymerases of Drosophila melanogaster.
Marygold SJ, Attrill H, Speretta E, Warner K, Magrane M, Berloco M, Cotterill S, McVey M, Rong Y, Yamaguchi M. Marygold SJ, et al. Fly (Austin). 2020 Mar-Dec;14(1-4):49-61. doi: 10.1080/19336934.2019.1710076. Epub 2020 Jan 14. Fly (Austin). 2020. PMID: 31933406 Free PMC article. Review. - Pan-cancer analysis of non-oncogene addiction to DNA repair.
Bermúdez-Guzmán L. Bermúdez-Guzmán L. Sci Rep. 2021 Dec 1;11(1):23264. doi: 10.1038/s41598-021-02773-3. Sci Rep. 2021. PMID: 34853396 Free PMC article. - Regulation of Error-Prone DNA Double-Strand Break Repair and Its Impact on Genome Evolution.
Hanscom T, McVey M. Hanscom T, et al. Cells. 2020 Jul 9;9(7):1657. doi: 10.3390/cells9071657. Cells. 2020. PMID: 32660124 Free PMC article. Review.
References
Publication types
MeSH terms
Substances
Grants and funding
- R01 CA222092/CA/NCI NIH HHS/United States
- P30 CA016086/CA/NCI NIH HHS/United States
- T32 GM008719/GM/NIGMS NIH HHS/United States
- R01 GM138834/GM/NIGMS NIH HHS/United States
- F31 CA260794/CA/NCI NIH HHS/United States
- P30 ES010126/ES/NIEHS NIH HHS/United States
- P30 CA016672/CA/NCI NIH HHS/United States
- DP2 HD091800/HD/NICHD NIH HHS/United States
- T32 CA071341/CA/NCI NIH HHS/United States
LinkOut - more resources
Full Text Sources
Other Literature Sources
Medical
Research Materials


