Multiple biomarkers of sepsis identified by novel time-lapse proteomics of patient serum - PubMed (original) (raw)
Multiple biomarkers of sepsis identified by novel time-lapse proteomics of patient serum
Nobuhiro Hayashi et al. PLoS One. 2019.
Abstract
Serum components of sepsis patients vary with the severity of infection, the resulting inflammatory response, per individual, and even over time. Tracking these changes is crucial in properly treating sepsis. Hence, several blood-derived biomarkers have been studied for their potential in assessing sepsis severity. However, the classical approach of selecting individual biomarkers is problematic in terms of accuracy and efficiency. We therefore present a novel approach for detecting biomarkers using longitudinal proteomics data. This does not require a predetermined set of proteins and can therefore reveal previously unknown related proteins. Our approach involves examining changes over time of both protein abundance and post-translational modifications in serum, using two-dimensional gel electrophoresis (2D-PAGE). 2D-PAGE was conducted using serum from n = 20 patients, collected at five time points, starting from the onset of sepsis. Changes in protein spots were examined using 49 spots for which the signal intensity changed by at least two-fold over time. These were then screened for significant spikes or dips in intensity that occurred exclusively in patients with adverse outcome. Individual level variation was handled by a mixed effects model. Finally, for each time transition, partial correlations between spots were estimated through a Gaussian graphical model (GGM) based on the ridge penalty. Identifications of spots of interest by tandem mass spectrometry revealed that many were either known biomarkers for inflammation (complement components), or had previously been suggested as biomarkers for kidney failure (haptoglobin) or liver failure (ceruloplasmin). The latter two are common complications in severe sepsis. In the GGM, many of the tightly connected spots shared known biological functions or even belonged to the same protein; including hemoglobin chains and acute phase proteins. Altogether, these results suggest that our screening method can successfully identify biomarkers for disease states and cluster biologically related proteins using longitudinal proteomics data derived from 2D-PAGE.
Conflict of interest statement
The authors have declared that no competing interests exist.
Figures
Fig 1. Two-dimensional electrophoresis images of the serum of sepsis patient No. 1.
Serum as collected A) at the start of treatment, B) after 1 day, C) after 3 days, D) after 5 days, and E) after 7 days. The data for the remaining 19 patients are included in the supplementary files (S1–S19 Figs).
Fig 2. Two-dimensional electrophoresis image of patient serum.
Serum from sample no. 9 (A, start of the treatment) was used. Molecular weight is indicated on the vertical axis, and isoelectric point is indicated on the horizontal axis. Among spots which signal changed substantially over time, those that were successfully identified are circled in red and numbered.
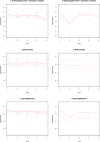
Fig 3. Significant changes in log-intensity of proteins over time from the spike-and-dip search.
This includes the changes in protein expression of hemoglobin beta1 and beta 2 chains, haptoglobin and ceruloplasmin observed in the surviving group (L) and adverse outcome group (D).
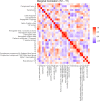
Fig 4. An ordinary heatmap of marginal correlations between differences in spot intensities from _t_1 to _t_2.
Row and column order were set by hierarchical clustering using f(x) = 1−cor(x) as distance function. Color represents positive (red) or negative (blue) correlations. Heatmaps corresponding to the other time point transitions are included as supplementary figures (S20, S21 and S22 Figs).
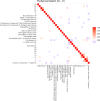
Fig 5. A heatmap of partial correlations between differences in spot intensities from _t_1 to _t_2.
Contrary to the heatmap in Fig 3, a heatmap of partial correlations as depicted here is relatively uncluttered. Sparsity was achieved by estimating the support of the inverse covariance matrix through a local false discovery rate of 0.05 as described in the methods section. Row and column order were set by hierarchical clustering using f(x) = 1−pcor(x) as distance function. Heatmaps of partial correlations corresponding to the other time point transitions are included as supplementary figures (S23, S24 and S25 Figs).
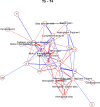
Fig 6. Non-zero partial correlations between differences in spot intensities from _t_1 to _t_2 displayed as a conditional independence network.
Line width is proportional to the strength of the partial correlation and color represents positive (red) or negative (blue) partial correlation.
Fig 7. Non-zero partial correlations between differences in spot intensities from _t_2 to _t_3 displayed as a conditional independence network.
Line width is proportional to the strength of the partial correlation and color represents positive (red) or negative (blue) partial correlation.
Fig 8. Non-zero partial correlations between differences in spot intensities from _t_3 to _t_4 displayed as a conditional independence network.
Line width is proportional to the strength of the partial correlation and color represents positive (red) or negative (blue) partial correlation.
Fig 9. Non-zero partial correlations between differences in spot intensities from _t_4 to _t_5 displayed as a conditional independence network.
Line width is proportional to the strength of the partial correlation and color represents positive (red) or negative (blue) partial correlation.
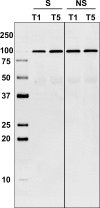
Fig 10. Detection of complement factor B protein in the surviving group (L) and adverse outcome group (D) by means of Western blotting.
Two time points of each group were compared to confirm the overall change over time (_t_1→_t_5).
Fig 11. Detection of haptoglobin in the surviving group (L) and adverse outcome group (D) by means of Western blotting.
Three time point of each group were compared to illustrate the progression over time (_t_3→_t_4→_t_5).
Similar articles
- Urinary proteomics analysis for sepsis biomarkers with iTRAQ labeling and two-dimensional liquid chromatography-tandem mass spectrometry.
Su L, Zhou R, Liu C, Wen B, Xiao K, Kong W, Tan F, Huang Y, Cao L, Xie L. Su L, et al. J Trauma Acute Care Surg. 2013 Mar;74(3):940-5. doi: 10.1097/TA.0b013e31828272c5. J Trauma Acute Care Surg. 2013. PMID: 23425763 Clinical Trial. - Targeted LC-MS/MS for the evaluation of proteomics biomarkers in the blood of neonates with necrotizing enterocolitis and late-onset sepsis.
Chatziioannou AC, Wolters JC, Sarafidis K, Thomaidou A, Agakidis C, Govorukhina N, Kuivenhoven JA, Bischoff R, Theodoridis G. Chatziioannou AC, et al. Anal Bioanal Chem. 2018 Nov;410(27):7163-7175. doi: 10.1007/s00216-018-1320-3. Epub 2018 Aug 23. Anal Bioanal Chem. 2018. PMID: 30141021 - Targeted mass spectrometry analysis of neutrophil-derived proteins released during sepsis progression.
Malmström E, Davidova A, Mörgelin M, Linder A, Larsen M, Qvortrup K, Nordenfelt P, Shannon O, Dzupova O, Holub M, Malmström J, Herwald H. Malmström E, et al. Thromb Haemost. 2014 Dec;112(6):1230-43. doi: 10.1160/TH14-04-0312. Epub 2014 Aug 7. Thromb Haemost. 2014. PMID: 25104417 - Translational research and biomarkers in neonatal sepsis.
Delanghe JR, Speeckaert MM. Delanghe JR, et al. Clin Chim Acta. 2015 Dec 7;451(Pt A):46-64. doi: 10.1016/j.cca.2015.01.031. Epub 2015 Feb 4. Clin Chim Acta. 2015. PMID: 25661089 Review. - [Recent progress of proteomics in sepsis].
Xiao K, Su LX, Xie LX. Xiao K, et al. Zhonghua Jie He He Hu Xi Za Zhi. 2013 Aug;36(8):606-8. Zhonghua Jie He He Hu Xi Za Zhi. 2013. PMID: 24252741 Review. Chinese. No abstract available.
Cited by
- The plasma peptides of sepsis.
Thavarajah T, Dos Santos CC, Slutsky AS, Marshall JC, Bowden P, Romaschin A, Marshall JG. Thavarajah T, et al. Clin Proteomics. 2020 Jul 2;17:26. doi: 10.1186/s12014-020-09288-5. eCollection 2020. Clin Proteomics. 2020. PMID: 32636717 Free PMC article. - Glycoproteoform Profiles of Individual Patients' Plasma Alpha-1-Antichymotrypsin are Unique and Extensively Remodeled Following a Septic Episode.
Čaval T, Lin YH, Varkila M, Reiding KR, Bonten MJM, Cremer OL, Franc V, Heck AJR. Čaval T, et al. Front Immunol. 2021 Jan 14;11:608466. doi: 10.3389/fimmu.2020.608466. eCollection 2020. Front Immunol. 2021. PMID: 33519818 Free PMC article. - Network analysis of the proteome and peptidome sheds light on human milk as a biological system.
Dekker PM, Boeren S, Saccenti E, Hettinga KA. Dekker PM, et al. Sci Rep. 2024 Mar 30;14(1):7569. doi: 10.1038/s41598-024-58127-2. Sci Rep. 2024. PMID: 38555284 Free PMC article. - New Approaches to Identify Sepsis Biomarkers: The Importance of Model and Sample Source for Mass Spectrometry.
Blangy-Letheule A, Persello A, Rozec B, Waard M, Lauzier B. Blangy-Letheule A, et al. Oxid Med Cell Longev. 2020 Dec 24;2020:6681073. doi: 10.1155/2020/6681073. eCollection 2020. Oxid Med Cell Longev. 2020. PMID: 33425215 Free PMC article. Review. - Longitudinal proteomics study of serum changes after allogeneic HSCT reveals potential markers of metabolic complications related to aGvHD.
Wong SY, Kato S, Rodenburg F, Tojo A, Hayashi N. Wong SY, et al. Sci Rep. 2022 Aug 17;12(1):14002. doi: 10.1038/s41598-022-18221-9. Sci Rep. 2022. PMID: 35977993 Free PMC article.
References
- Vincent JL, Moreno R, Takala J, Willatts S, De Mendonca A, Bruining H, et al. The SOFA (Sepsis-related Organ Failure Assessment) score to describe organ dysfunction/failure. On behalf of the Working Group on Sepsis-Related Problems of the European Society of Intensive Care Medicine. Intensive Care Med. 1996;22(7):707–10. Epub 1996/07/01. 10.1007/bf01709751 . - DOI - PubMed
Publication types
MeSH terms
Substances
Grants and funding
This work was supported in part by Grants-in-Aid for Scientific Research C 25462831, the Otsuka Toshimi Scholarship Foundation, and 16K11421 from the Ministry of Education, Science, Sports and Culture of Japan. A part of this study was supported by NIMS Nanofabrication Platform in Nanotechnology Platform Project sponsored by the Ministry of Education, Culture, Sports, Science and Technology (MEXT), Japan.
LinkOut - more resources
Full Text Sources
Medical


