Dissociation of solid tumor tissues with cold active protease for single-cell RNA-seq minimizes conserved collagenase-associated stress responses - PubMed (original) (raw)
doi: 10.1186/s13059-019-1830-0.
Kieran R Campbell 1 2 3, Allen W Zhang 1 4 5, Farhia Kabeer 1 6, Jamie L P Lim 7, Justina Biele 1, Peter Eirew 1, Daniel Lai 1, Andrew McPherson 1 7, Esther Kong 1, Cherie Bates 1, Kelly Borkowski 1, Matt Wiens 1, Brittany Hewitson 1, James Hopkins 1, Jenifer Pham 1, Nicholas Ceglia 4, Richard Moore 8, Andrew J Mungall 8, Jessica N McAlpine 9; CRUK IMAXT Grand Challenge Team; Sohrab P Shah 10 11 12, Samuel Aparicio 13 14
Affiliations
- PMID: 31623682
- PMCID: PMC6796327
- DOI: 10.1186/s13059-019-1830-0
Dissociation of solid tumor tissues with cold active protease for single-cell RNA-seq minimizes conserved collagenase-associated stress responses
Ciara H O'Flanagan et al. Genome Biol. 2019.
Abstract
Background: Single-cell RNA sequencing (scRNA-seq) is a powerful tool for studying complex biological systems, such as tumor heterogeneity and tissue microenvironments. However, the sources of technical and biological variation in primary solid tumor tissues and patient-derived mouse xenografts for scRNA-seq are not well understood.
Results: We use low temperature (6 °C) protease and collagenase (37 °C) to identify the transcriptional signatures associated with tissue dissociation across a diverse scRNA-seq dataset comprising 155,165 cells from patient cancer tissues, patient-derived breast cancer xenografts, and cancer cell lines. We observe substantial variation in standard quality control metrics of cell viability across conditions and tissues. From the contrast between tissue protease dissociation at 37 °C or 6 °C, we observe that collagenase digestion results in a stress response. We derive a core gene set of 512 heat shock and stress response genes, including FOS and JUN, induced by collagenase (37 °C), which are minimized by dissociation with a cold active protease (6 °C). While induction of these genes was highly conserved across all cell types, cell type-specific responses to collagenase digestion were observed in patient tissues.
Conclusions: The method and conditions of tumor dissociation influence cell yield and transcriptome state and are both tissue- and cell-type dependent. Interpretation of stress pathway expression differences in cancer single-cell studies, including components of surface immune recognition such as MHC class I, may be especially confounded. We define a core set of 512 genes that can assist with the identification of such effects in dissociated scRNA-seq experiments.
Keywords: Breast cancer; Gene expression; Ovarian cancer; Quality control; RNA-seq; Single cell; Tissue dissociation; Tumor microenvironment.
Conflict of interest statement
SPS and SA are founders, shareholders, and consultants of Contextual Genomics Inc. The other authors declare that they have no competing interests.
Figures
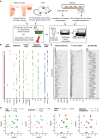
Fig. 1
Overview of 48 single-cell experiments generated in this study. a Schematic showing the various substrates used to generate the 48 single-cell experiments in this dataset. b Descriptions of the cell status, substrate, cancer type, dissociation temperature, and tissue state of each sample in the dataset. c Substantial variability in three key QC metrics (number of genes detected, percentage of counts mapping to the mitochondrial genome, number of UMIs sequenced) across all experiments. d Embedding of all 48 single-cell experiments to a low-dimensional projection with uniform manifold approximation and projection [12]
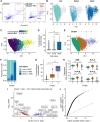
Fig. 2
Transcriptomic landscape of live, dead, and dying cells. a FACS analysis showing gating strategy for untreated, live cells (PI−/annexin V−) or TNFα-treated dying cells (PI/annexin V+) and dead cells (PI+/annexin V+). b PCA projection of the three cell conditions showing approximate segregation of cell status along the first principal component (PC1), with live and dying cells enriched at lower PC1 values and dead cells enriched at higher values. c PCA projection colored by the percentage mitochondrial genes (“% transcriptome mitochondrial”) shows significant increase along the PC1. d Dead cells exhibit significantly higher percentage of the transcriptome as mitochondrial compared to both live and dying cells. e Unsupervised clustering of the gene expression profiles clusters the cells into three groups, approximately tracking both PC1 of the data and the percentage of transcriptome mitochondrial. f The composition of each cluster demonstrates that cluster 1 is primarily composed of live cells and cluster 2 a mix of live, dying, and dead cells, while cluster 3 is composed mainly of dead cells. g The percentage of transcriptome mitochondrial is significantly different between the three clusters, with a step increase in proportion moving from cluster 1 to 2 and 2 to 3. h Cluster 2 significantly upregulates the MHC class I gene set, suggesting it represents stressed or pre-apoptotic cells. i Differential expression analysis of transcriptomically “healthy” cells within cluster 1 reveals residual differences between cells sorted as live and dead. j The distribution of absolute effect sizes (log fold change) of live vs. dead cells within cluster 1 (_x_-axis) compared to between clusters 1 and 2 (_y_-axis) demonstrates the residual effect on the transcriptome of being live/dead sorted is small compared to the inter-cluster expression variance
Fig. 3
Dissociation with collagenase at 37 °C induces a distinct stress response in 23,731 cells from PDX samples that is minimized by dissociation at 6 °C. a The top 40 genes (by log fold change) from the 11,975 identified as significantly differentially expressed between cells digested at 6 °C and 37 °C. b UMAP plots of 23,731 cells colored by digestion temperature (top) then by normalized expression of three key stress response genes (FOS, JUNB, NR4A1) demonstrate a distinct concordance between temperature and induction of the stress gene signature. Expression values are log normalized counts winsorized to [0, 2) then scaled to [0, 1). c Pathway analysis of differentially expressed genes with the MSigDB hallmark gene sets highlights induction of genes involved in NF-κB signaling at 37 °C digestion with 46.5% of 200 genes annotated in the pathway being found in the 512 core gene set
Fig. 4
Disentangling the effects of digestion time and digestion method on transcriptomic response. a Mean normalized expression of genes in the core gene set as a function of digestion time colored by digestion temperature. Digestion by collagenase causes upregulation of the gene set at all time points, with a subset showing further upregulation as digestion time increases. B Log fold changes of a 2-h vs. 30-min digestion for collagenase only as a function of log counts-per-million. c Log fold changes of a collagenase vs. cold protease digestion at 30-min digestion time as a function of log counts-per-million. d Log fold changes of a collagenase vs. cold protease digestion at 2-h digestion time as a function of log counts-per-million. e Log fold changes of a 2-h vs. 30-min digestion (collagenase only) compared to a collagenase vs. cold protease digestion at 2 h demonstrate a large overlap between genes affected (ρ = 0.8)
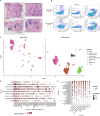
Fig. 5
Conserved stress response to the collagenase dissociation method in breast and ovarian patient tissues. a Histology of ovarian (top) and breast (bottom) cancer patient samples highlighting the architecture of the tumor microenvironment. b FACS analysis of ovarian tumor tissue dissociated at 37 °C with collagenase or 6 °C with cold active protease and stained with markers for tumor cells (EpCAM), endothelial cells (CD31), fibroblasts (FAP), lymphocytes (CD45), B cells (CD19), NK cells (CD56), and T cells (CD8, CD3). c UMAP of combined scRNA-seq experiments of ovarian cancer (n = 2) and breast cancer (n = 3) patient tissues with cell type assignments according to known gene markers for each cell type. d The top 40 genes from the gene set derived in Fig. 3 as expressed in each cell type in breast and ovarian patient samples. Black circles around points denote significance at 5% FDR. e Pathway analysis of the differential expression results with the MSigDB hallmark gene sets for each cell type
Similar articles
- Gut mucosa dissociation protocols influence cell type proportions and single-cell gene expression levels.
Uniken Venema WTC, Ramírez-Sánchez AD, Bigaeva E, Withoff S, Jonkers I, McIntyre RE, Ghouraba M, Raine T, Weersma RK, Franke L, Festen EAM, van der Wijst MGP. Uniken Venema WTC, et al. Sci Rep. 2022 Jun 14;12(1):9897. doi: 10.1038/s41598-022-13812-y. Sci Rep. 2022. PMID: 35701452 Free PMC article. - No detectable alloreactive transcriptional responses under standard sample preparation conditions during donor-multiplexed single-cell RNA sequencing of peripheral blood mononuclear cells.
McGinnis CS, Siegel DA, Xie G, Hartoularos G, Stone M, Ye CJ, Gartner ZJ, Roan NR, Lee SA. McGinnis CS, et al. BMC Biol. 2021 Jan 20;19(1):10. doi: 10.1186/s12915-020-00941-x. BMC Biol. 2021. PMID: 33472616 Free PMC article. - Advantages of Single-Nucleus over Single-Cell RNA Sequencing of Adult Kidney: Rare Cell Types and Novel Cell States Revealed in Fibrosis.
Wu H, Kirita Y, Donnelly EL, Humphreys BD. Wu H, et al. J Am Soc Nephrol. 2019 Jan;30(1):23-32. doi: 10.1681/ASN.2018090912. Epub 2018 Dec 3. J Am Soc Nephrol. 2019. PMID: 30510133 Free PMC article. - Single-cell RNA sequencing in breast cancer: Understanding tumor heterogeneity and paving roads to individualized therapy.
Ding S, Chen X, Shen K. Ding S, et al. Cancer Commun (Lond). 2020 Aug;40(8):329-344. doi: 10.1002/cac2.12078. Epub 2020 Jul 12. Cancer Commun (Lond). 2020. PMID: 32654419 Free PMC article. Review. - Single-cell RNA sequencing in cancer research.
Zhang Y, Wang D, Peng M, Tang L, Ouyang J, Xiong F, Guo C, Tang Y, Zhou Y, Liao Q, Wu X, Wang H, Yu J, Li Y, Li X, Li G, Zeng Z, Tan Y, Xiong W. Zhang Y, et al. J Exp Clin Cancer Res. 2021 Mar 1;40(1):81. doi: 10.1186/s13046-021-01874-1. J Exp Clin Cancer Res. 2021. PMID: 33648534 Free PMC article. Review.
Cited by
- An era of single-cell genomics consortia.
Ando Y, Kwon AT, Shin JW. Ando Y, et al. Exp Mol Med. 2020 Sep;52(9):1409-1418. doi: 10.1038/s12276-020-0409-x. Epub 2020 Sep 15. Exp Mol Med. 2020. PMID: 32929222 Free PMC article. Review. - A human stomach cell type transcriptome atlas.
Öling S, Struck E, Noreen-Thorsen M, Zwahlen M, von Feilitzen K, Odeberg J, Pontén F, Lindskog C, Uhlén M, Dusart P, Butler LM. Öling S, et al. BMC Biol. 2024 Feb 14;22(1):36. doi: 10.1186/s12915-024-01812-5. BMC Biol. 2024. PMID: 38355543 Free PMC article. - Single-cell RNA sequencing reveals the effects of chemotherapy on human pancreatic adenocarcinoma and its tumor microenvironment.
Werba G, Weissinger D, Kawaler EA, Zhao E, Kalfakakou D, Dhara S, Wang L, Lim HB, Oh G, Jing X, Beri N, Khanna L, Gonda T, Oberstein P, Hajdu C, Loomis C, Heguy A, Sherman MH, Lund AW, Welling TH, Dolgalev I, Tsirigos A, Simeone DM. Werba G, et al. Nat Commun. 2023 Feb 13;14(1):797. doi: 10.1038/s41467-023-36296-4. Nat Commun. 2023. PMID: 36781852 Free PMC article. - Cellular and transcriptional diversity over the course of human lactation.
Nyquist SK, Gao P, Haining TKJ, Retchin MR, Golan Y, Drake RS, Kolb K, Mead BE, Ahituv N, Martinez ME, Shalek AK, Berger B, Goods BA. Nyquist SK, et al. Proc Natl Acad Sci U S A. 2022 Apr 12;119(15):e2121720119. doi: 10.1073/pnas.2121720119. Epub 2022 Apr 4. Proc Natl Acad Sci U S A. 2022. PMID: 35377806 Free PMC article. - Tissue-resident memory CD8+ T cells possess unique transcriptional, epigenetic and functional adaptations to different tissue environments.
Crowl JT, Heeg M, Ferry A, Milner JJ, Omilusik KD, Toma C, He Z, Chang JT, Goldrath AW. Crowl JT, et al. Nat Immunol. 2022 Jul;23(7):1121-1131. doi: 10.1038/s41590-022-01229-8. Epub 2022 Jun 27. Nat Immunol. 2022. PMID: 35761084 Free PMC article.
References
Publication types
MeSH terms
Substances
LinkOut - more resources
Full Text Sources
Other Literature Sources
Research Materials
Miscellaneous


