Impact of Intravenous Iron on Oxidative Stress and Mitochondrial Function in Experimental Chronic Kidney Disease - PubMed (original) (raw)
Impact of Intravenous Iron on Oxidative Stress and Mitochondrial Function in Experimental Chronic Kidney Disease
Faisal Nuhu et al. Antioxidants (Basel). 2019.
Abstract
Background: Mitochondrial dysfunction is observed in chronic kidney disease (CKD). Iron deficiency anaemia (IDA), a common complication in CKD, is associated with poor clinical outcomes affecting mitochondrial function and exacerbating oxidative stress. Intravenous (iv) iron, that is used to treat anaemia, may lead to acute systemic oxidative stress. This study evaluated the impact of iv iron on mitochondrial function and oxidative stress.
Methods: Uraemia was induced surgically in male Sprague-Dawley rats and studies were carried out 12 weeks later in two groups sham operated and uraemic (5/6 nephrectomy) rats not exposed to i.v. iron versus sham operated and uraemic rats with iv iron.
Results: Induction of uraemia resulted in reduced iron availability (serum iron: 31.1 ± 1.8 versus 46.4 ± 1.4 µM), low total iron binding capacity (26.4 ± 0.7 versus 29.5 ± 0.8 µM), anaemia (haematocrit: 42.5 ± 3.0 versus 55.0 ± 3.0%), cardiac hypertrophy, reduced systemic glutathione peroxidase activity (1.12 ± 0.11 versus 1.48 ± 0.12 U/mL), tissue oxidative stress (oxidised glutathione: 0.50 ± 0.03 versus 0.36 ± 0.04 nmol/mg of tissue), renal mitochondrial dysfunction (proton/electron leak: 61.8 ± 8.0 versus 22.7 ± 5.77) and complex I respiration (134.6 ± 31.4 versus 267.6 ± 26.4 pmol/min/µg). Iron therapy had no effect on renal function and cardiac hypertrophy but improved anaemia and systemic glutathione peroxidase (GPx) activity. There was increased renal iron content and complex II and complex IV dysfunction.
Conclusion: Iron therapy improved iron deficiency anaemia in CKD without significant impact on renal function or oxidant status.
Keywords: anaemia; chronic kidney disease; iron; mitochondrial dysfunction; oxidative stress.
Conflict of interest statement
All authors have received research grants from the East Riding Cardiac Trust, UK and Tadeka, UK, and funding was also received from the Local Hull Teaching Hospitals NHS Trust Renal Research Charitable Fund to fund the project and the salary of Faisal Nuhu. The funders had no role in the design of the study; in the collection, analyses or interpretation of data; in the writing of the manuscript, or in the decision to publish the results.
Figures
Figure 1
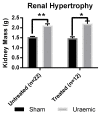
Renal hypertrophy in uraemic and sham animals (n = 22) and in animals exposed to intravenous (iv) iron therapy at six weeks was assessed by measuring left kidney mass. Data are presented as mean ± SEM, (* p < 0.05 and ** p < 0.01).
Figure 2
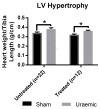
Cardiac hypertrophy 12 weeks post-surgical induction of uraemia was evaluated by measurement of heart weight to tibia length ratio in uraemia and sham animals with and without iv iron. Data are presented as mean ± SEM (* p < 0.05).
Figure 3
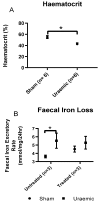
Iron analysis. (A) Haematocrit was measured to confirm anaemia; (B) Faecal Iron loss as a measure of iron malabsorption; (C) Urinary iron excretion was evaluated to study the cause of iron deficiency. Data are presented as mean ± SEM (* p < 0.05, ** p < 0.01).
Figure 3
Iron analysis. (A) Haematocrit was measured to confirm anaemia; (B) Faecal Iron loss as a measure of iron malabsorption; (C) Urinary iron excretion was evaluated to study the cause of iron deficiency. Data are presented as mean ± SEM (* p < 0.05, ** p < 0.01).
Figure 4
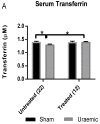
Transferrin analysis (A): Serum transferrin level and (B): Urinary transferrin loss at various stages of uraemia. Data are presented as mean ± SEM (* p < 0.05, ** p < 0.01).
Figure 4
Transferrin analysis (A): Serum transferrin level and (B): Urinary transferrin loss at various stages of uraemia. Data are presented as mean ± SEM (* p < 0.05, ** p < 0.01).
Figure 5
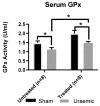
Serum glutathione peroxidase activity. Systemic anti-oxidant capacity was investigated through the measurement of glutathione peroxidase activity in the serum of uraemic and sham animals. Results are presented as mean ± SEM (* p < 0.05).
Figure 6
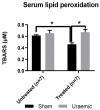
Serum TBARS. TBARS (thiobarbuturic acid reactive substances) were measured to access lipid peroxidation in uraemic and sham animals. Results are presented as mean ± SEM. (* p < 0.01).
Figure 7
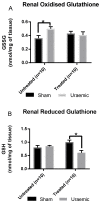
Endogenous antioxidant glutathione level in kidney tissue. (A) Renal oxidised glutathione in sham (n = 10) and uraemic animals (n = 10) with and without i.v. iron therapy; (B) renal reduced glutathione in sham (n = 10) and uraemic animals (n = 10) with and without i.v. iron therapy. Results are presented as mean ± SEM. (* p < 0.05).
Figure 8
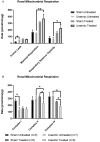
Isolated Mitochondrial measures of function including Respiratory rates and mitochondrial respiration in the presence of: (A) 0.5 µg mitochondrial protein, 10 mM succinate and 2 µM rotenone; (B) 0.6g mitochondrial protein, 10 mM pyruvate, 2 mM malate and 4 µM FCCP (carbonyl cyanide 4-(trifluoromethoxy) phenylhydrazone) with or without 10 mM malonate. In Fig 8B the electron transport chains complexes I, II and IV were measured. Results are presented as mean ± SEM. (* p < 0.05; ** p < 0.01). Proton leak = (minimum rate measured after Oligomycin injection) − (non-mitochondrial respiration rate or minimum rate measured after injection of Antimycin A); Maximal respiration = (maximal rate measured after FCCP injection) – (non-mitochondrial respiration rate); Respiratory reserve capacity = (maximal respiration – basal respiration).
Figure 9
Transmission electron microscopic representation of uraemic mitochondria (A) with evidence of mitochondrial fragmentation (fission) as indicated by the presence of smaller mitochondrial spheres; swollen mitochondria with sparsely arranged cristae relative to sham mitochondria (B). Arrows indicate mitochondria.
Similar articles
- Phosphate Binder, Ferric Citrate, Attenuates Anemia, Renal Dysfunction, Oxidative Stress, Inflammation, and Fibrosis in 5/6 Nephrectomized CKD Rats.
Jing W, Nunes ACF, Farzaneh T, Khazaeli M, Lau WL, Vaziri ND. Jing W, et al. J Pharmacol Exp Ther. 2018 Oct;367(1):129-137. doi: 10.1124/jpet.118.249961. Epub 2018 Aug 9. J Pharmacol Exp Ther. 2018. PMID: 30093458 - Dietary supplementation with ketoacids protects against CKD-induced oxidative damage and mitochondrial dysfunction in skeletal muscle of 5/6 nephrectomised rats.
Wang D, Wei L, Yang Y, Liu H. Wang D, et al. Skelet Muscle. 2018 May 31;8(1):18. doi: 10.1186/s13395-018-0164-z. Skelet Muscle. 2018. PMID: 29855350 Free PMC article. - Oxidative Stress and Cardiovascular Complications in Chronic Kidney Disease, the Impact of Anaemia.
Nuhu F, Bhandari S. Nuhu F, et al. Pharmaceuticals (Basel). 2018 Oct 11;11(4):103. doi: 10.3390/ph11040103. Pharmaceuticals (Basel). 2018. PMID: 30314359 Free PMC article. Review. - Iron deficiency anaemia in chronic kidney disease.
Wittwer I. Wittwer I. J Ren Care. 2013 Sep;39(3):182-8. doi: 10.1111/j.1755-6686.2013.12026.x. Epub 2013 Aug 3. J Ren Care. 2013. PMID: 23911105 Review.
Cited by
- A Randomized Trial of Intravenous Iron Supplementation and Exercise on Exercise Capacity in Iron-Deficient Nonanemic Patients With CKD.
Greenwood SA, Oliveira BA, Asgari E, Ayis S, Baker LA, Beckley-Hoelscher N, Goubar A, Banerjee D, Bhandari S, Chilcot J, Burton JO, Kalra PA, Lightfoot CJ, Macdougall IC, McCafferty K, Mercer TH, Okonko DO, Reid C, Reid F, Smith AC, Swift PA, Mangelis A, Watson E, Wheeler DC, Wilkinson TJ, Bramham K. Greenwood SA, et al. Kidney Int Rep. 2023 May 9;8(8):1496-1505. doi: 10.1016/j.ekir.2023.05.002. eCollection 2023 Aug. Kidney Int Rep. 2023. PMID: 37547514 Free PMC article. - The Trace Element Concentrations and Oxidative Stress Parameters in Afterbirths from Women with Multiple Pregnancies.
Grzeszczak K, Kapczuk P, Kupnicka P, Simińska DK, Lebdowicz-Knul J, Kwiatkowski SK, Łanocha-Arendarczyk N, Chlubek D, Kosik-Bogacka DI. Grzeszczak K, et al. Biomolecules. 2023 May 6;13(5):797. doi: 10.3390/biom13050797. Biomolecules. 2023. PMID: 37238667 Free PMC article. - Iron therapy mitigates chronic kidney disease progression by regulating intracellular iron status of kidney macrophages.
Patino E, Bhatia D, Vance SZ, Antypiuk A, Uni R, Campbell C, Castillo CG, Jaouni S, Vinchi F, Choi ME, Akchurin O. Patino E, et al. JCI Insight. 2023 Jan 10;8(1):e159235. doi: 10.1172/jci.insight.159235. JCI Insight. 2023. PMID: 36394951 Free PMC article. - Multi-Organ inducedtoxicity of metal mixture (CdCl2, HgCl2, Pb(NO3)), and the ameliorative potentials of plantain Musa paradisiaca (F. Musaceae) stem juice on male Wistar rats.
Ezejiofor AN, Orish CN, Akaranta O. Ezejiofor AN, et al. Int J Physiol Pathophysiol Pharmacol. 2022 Aug 15;14(4):211-224. eCollection 2022. Int J Physiol Pathophysiol Pharmacol. 2022. PMID: 36161263 Free PMC article. - The effect of intravenous iron supplementation on exercise capacity in iron-deficient but not anaemic patients with chronic kidney disease: study design and baseline data for a multicentre prospective double-blind randomised controlled trial.
Greenwood SA, Beckley-Hoelscher N, Asgari E, Ayis S, Baker LA, Banerjee D, Bhandari S, Bramham K, Chilcot J, Burton J, Kalra PA, Lightfoot CJ, McCafferty K, Mercer TH, Okonko DO, Oliveira B, Reid C, Smith AC, Swift PA, Mangelis A, Watson E, Wheeler DC, Wilkinson TJ, Reid F, Macdougall IC. Greenwood SA, et al. BMC Nephrol. 2022 Jul 27;23(1):268. doi: 10.1186/s12882-022-02896-3. BMC Nephrol. 2022. PMID: 35896969 Free PMC article. Clinical Trial.
References
- Regidor D.L., Kopple J.D., Kovesdy C.P., Kilpatrick R.D., McAllister C.J., Aronovitz J., Greenland S., Kalantar-Zadeh K. Associations between Changes in Hemoglobin and Administered Erythropoiesis-Stimulating Agent and Survival in Hemodialysis Patients. J. Am. Soc. Nephrol. 2006;17:1181–1191. doi: 10.1681/ASN.2005090997. - DOI - PubMed
LinkOut - more resources
Full Text Sources
