Genomic architecture and introgression shape a butterfly radiation - PubMed (original) (raw)
. 2019 Nov 1;366(6465):594-599.
doi: 10.1126/science.aaw2090.
Paul B Frandsen 2 3, Miriam Miyagi 4, Bernardo Clavijo 5, John Davey 6 7, Rebecca B Dikow 3, Gonzalo García-Accinelli 5, Steven M Van Belleghem 8, Nick Patterson 9 10, Daniel E Neafsey 10 11, Richard Challis 12, Sujai Kumar 13, Gilson R P Moreira 14, Camilo Salazar 15, Mathieu Chouteau 16, Brian A Counterman 17, Riccardo Papa 8 18, Mark Blaxter 12, Robert D Reed 19, Kanchon K Dasmahapatra 6, Marcus Kronforst 20, Mathieu Joron 21, Chris D Jiggins 7, W Owen McMillan 22, Federica Di Palma 5, Andrew J Blumberg 23, John Wakeley 4, David Jaffe 10 24, James Mallet 1
Affiliations
- PMID: 31672890
- PMCID: PMC7197882
- DOI: 10.1126/science.aaw2090
Genomic architecture and introgression shape a butterfly radiation
Nathaniel B Edelman et al. Science. 2019.
Abstract
We used 20 de novo genome assemblies to probe the speciation history and architecture of gene flow in rapidly radiating Heliconius butterflies. Our tests to distinguish incomplete lineage sorting from introgression indicate that gene flow has obscured several ancient phylogenetic relationships in this group over large swathes of the genome. Introgressed loci are underrepresented in low-recombination and gene-rich regions, consistent with the purging of foreign alleles more tightly linked to incompatibility loci. Here, we identify a hitherto unknown inversion that traps a color pattern switch locus. We infer that this inversion was transferred between lineages by introgression and is convergent with a similar rearrangement in another part of the genus. These multiple de novo genome sequences enable improved understanding of the importance of introgression and selective processes in adaptive radiation.
Copyright © 2019 The Authors, some rights reserved; exclusive licensee American Association for the Advancement of Science. No claim to original U.S. Government Works.
Conflict of interest statement
Competing interests: Authors declare no competing interests.
Figures
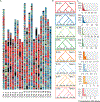
Fig. 1:. Phylogeny and phylogenetic networks of Heliconius show lack of support for bifurcating tree.
A. All nodes resolved in a majority of species trees are shown in this cladogram (heavy black lines), while the poorly resolved silvaniform clade is collapsed as a polytomy (Fig. S20). The 500 colored trees were sampled from 10 kb non-overlapping windows and constructed with maximum likelihood. B, C. High-confidence tree structure (black) and introgression events (red) are shown as solid lines. Dashed red lines indicate weakly supported introgression events. Grey branch ends are cosmetic. The _melpomene-_silvaniform clade is shown in B, the erato-sara clade in C. Euclidean lengths of solid black lines are proportional to genetic distance along the branches. Scale bars in units of substitutions per site. Breaks at the base in B indicate that the branch leading to H. doris has been shortened for display.
Fig. 2:. Local evolutionary history in the erato-sara clade is heterogeneous across the genome.
A. Each bar represents a chromosome, in terms of the H. erato reference (14). Colored bands represent tree topologies of each 50 kb window; colors correspond to the topologies in B, with black regions showing missing data. B. The eight most common trees are shown. The value in the top left corner is the percentage of all 50 kb windows that recover that topology. C. Each histogram corresponds to the topology of the same color in B, and shows the distribution of the number of consecutive 50 kb windows with that topology. Arrows indicate long blocks in inversions.
Fig. 3:. Chromosomal architecture is strongly correlated with local topology.
Tree 1 is shown in red, and Tree 2 is shown in blue, as in Fig. 2. A. Tree 1 shows a negative relationship with chromosome size, while Tree 2 shows a positive relationship. Lines are linear regressions with chromosome 21 excluded. Numbers along top indicate chromosome number. B. Each chromosome was divided into 10 equally sized bins, and the occupancy of each topology in each bin was calculated as the number of windows that recovered the topology in the bin divided by the number of windows that recovered the topology in the chromosome. C. Windows are binned by recombination rate, and boxes show the fraction of each tree in each bin for each chromosome separately. Numbers above boxes are the number of windows in each bin. D. Boxes show the relationship of tree topology with coding density. Asterisk denotes significance at 5% level (paired t-test, p<0.025). In all boxplots, central line is median, box edges are first and third quartile, and whiskers extend to the largest value no further than 1.5*(inter-quartile range).
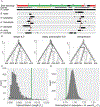
Fig. 4:. Parallel evolution of a major inversion at the cortex supergene locus.
A. Map of 1.7 Mb region on chromosome 15. Coordinates are in terms of Hmel 2.5, and ticks are in Mb. Tree topology colors correspond to those in Fig. 2. Genes are shown as black rectangles; cortex is highlighted in yellow. Each line shows the mapping of a single contig. Aligned sections of each contig are shown as thick bars, while unaligned sections are shown as dotted lines. Arrows indicate the strand of the alignment. The H. erato group breakpoints are shown with red vertical lines, while the H. numata breakpoints are shown with green vertical lines. B. Evolutionary hypotheses consistent with the topology observed in this inversion in the context of the previously estimated phylogenetic network. The three species used in the triplet gene tree method – H. erato, H. telesiphe, and H. sara – are shown as black lines, while lineages not included are shown as grey lines. C. Histogram of internal branch lengths (T 2) in windows with the topology H. erato, (H. telesiphe, H. sara). The inferred ILS distribution is shown as a dashed line, and the inferred introgression distribution is shown as a dotted line. The average internal branch length in the inversion is shown as a green vertical line. D. Histogram of normalized DXY (_T_3) between H. telesiphe and H. sara. Mean normalized DXY in the inversion is shown as a green vertical line
Comment in
- Mapping footprints of past genetic exchange.
Rieseberg LH. Rieseberg LH. Science. 2019 Nov 1;366(6465):570-571. doi: 10.1126/science.aaz1576. Science. 2019. PMID: 31672881 No abstract available.
Similar articles
- Divergence with gene flow across a speciation continuum of Heliconius butterflies.
Supple MA, Papa R, Hines HM, McMillan WO, Counterman BA. Supple MA, et al. BMC Evol Biol. 2015 Sep 24;15:204. doi: 10.1186/s12862-015-0486-y. BMC Evol Biol. 2015. PMID: 26403600 Free PMC article. - Butterfly genome reveals promiscuous exchange of mimicry adaptations among species.
Heliconius Genome Consortium. Heliconius Genome Consortium. Nature. 2012 Jul 5;487(7405):94-8. doi: 10.1038/nature11041. Nature. 2012. PMID: 22722851 Free PMC article. - Supergene Evolution Triggered by the Introgression of a Chromosomal Inversion.
Jay P, Whibley A, Frézal L, Rodríguez de Cara MÁ, Nowell RW, Mallet J, Dasmahapatra KK, Joron M. Jay P, et al. Curr Biol. 2018 Jun 4;28(11):1839-1845.e3. doi: 10.1016/j.cub.2018.04.072. Epub 2018 May 24. Curr Biol. 2018. PMID: 29804810 - Introgression of wing pattern alleles and speciation via homoploid hybridization in Heliconius butterflies: a review of evidence from the genome.
Brower AV. Brower AV. Proc Biol Sci. 2012 Dec 12;280(1752):20122302. doi: 10.1098/rspb.2012.2302. Print 2013 Feb 7. Proc Biol Sci. 2012. PMID: 23235702 Free PMC article. Review. - Heliconius butterflies: a window into the evolution and development of diversity.
Van Belleghem SM, Lewis JJ, Rivera ES, Papa R. Van Belleghem SM, et al. Curr Opin Genet Dev. 2021 Aug;69:72-81. doi: 10.1016/j.gde.2021.01.010. Epub 2021 Mar 11. Curr Opin Genet Dev. 2021. PMID: 33714874 Free PMC article. Review.
Cited by
- Drainage-structuring of ancestral variation and a common functional pathway shape limited genomic convergence in natural high- and low-predation guppies.
Whiting JR, Paris JR, van der Zee MJ, Parsons PJ, Weigel D, Fraser BA. Whiting JR, et al. PLoS Genet. 2021 May 24;17(5):e1009566. doi: 10.1371/journal.pgen.1009566. eCollection 2021 May. PLoS Genet. 2021. PMID: 34029313 Free PMC article. - Genomic, Transcriptomic and Epigenomic Tools to Study the Domestication of Plants and Animals: A Field Guide for Beginners.
Barrera-Redondo J, Piñero D, Eguiarte LE. Barrera-Redondo J, et al. Front Genet. 2020 Jul 15;11:742. doi: 10.3389/fgene.2020.00742. eCollection 2020. Front Genet. 2020. PMID: 32760427 Free PMC article. Review. - Genomic insights into the evolutionary relationships and demographic history of kiwi.
Westbury MV, De Cahsan B, Shepherd LD, Holdaway RN, Duchene DA, Lorenzen ED. Westbury MV, et al. PLoS One. 2022 Oct 10;17(10):e0266430. doi: 10.1371/journal.pone.0266430. eCollection 2022. PLoS One. 2022. PMID: 36215252 Free PMC article. - The genome of the black-footed cat: Revealing a rich natural history and urgent conservation priorities for small felids.
Yuan J, Kitchener AC, Lackey LB, Sun T, Jiangzuo Q, Tuohetahong Y, Zhao L, Yang P, Wang G, Huang C, Wang J, Hou W, Liu Y, Chen W, Mi D, Murphy WJ, Li G. Yuan J, et al. Proc Natl Acad Sci U S A. 2024 Jan 9;121(2):e2310763120. doi: 10.1073/pnas.2310763120. Epub 2024 Jan 2. Proc Natl Acad Sci U S A. 2024. PMID: 38165928 Free PMC article. - The recombination landscape of introgression in yeast.
Schwarzkopf EJ, Brandt N, Heil CS. Schwarzkopf EJ, et al. bioRxiv [Preprint]. 2024 Jul 9:2024.01.04.574263. doi: 10.1101/2024.01.04.574263. bioRxiv. 2024. PMID: 39026729 Free PMC article. Updated. Preprint.
References
- Schluter D, The Ecology of Adaptive Radiation (OUP Oxford, 2000).
- Lamichhaney S, Berglund J, Almen MS, Maqbool K, Grabherr M, Martinez-Barrio A, Promerová M, Rubin C-J, Wang C, Zamani N, Grant BR, Grant PR, Webster MT, Andersson L, Evolution of Darwin’s finches and their beaks revealed by genome sequencing. Nature 518, 371–375 (2015). - PubMed
Publication types
MeSH terms
Grants and funding
- R01 GM108626/GM/NIGMS NIH HHS/United States
- R01 HG003474/HG/NHGRI NIH HHS/United States
- U54 CA193313/CA/NCI NIH HHS/United States
- R35 GM131828/GM/NIGMS NIH HHS/United States
- U19 AI110818/AI/NIAID NIH HHS/United States
- U54 HG003067/HG/NHGRI NIH HHS/United States
- P20 GM103475/GM/NIGMS NIH HHS/United States
LinkOut - more resources
Full Text Sources
Other Literature Sources


