Yin Yang 1 facilitates hepatocellular carcinoma cell lipid metabolism and tumor progression by inhibiting PGC-1β-induced fatty acid oxidation - PubMed (original) (raw)
. 2019 Oct 14;9(25):7599-7615.
doi: 10.7150/thno.34931. eCollection 2019.
Affiliations
- PMID: 31695789
- PMCID: PMC6831470
- DOI: 10.7150/thno.34931
Yin Yang 1 facilitates hepatocellular carcinoma cell lipid metabolism and tumor progression by inhibiting PGC-1β-induced fatty acid oxidation
Yanjun Li et al. Theranostics. 2019.
Abstract
Lipid accumulation is a driving force in tumor development, as it provides tumor cells with both energy and the building blocks of phospholipids for construction of cell membranes. Aberrant homeostasis of lipid metabolism has been observed in various tumors; however, the molecular mechanism has not been fully elucidated. Methods: Yin yang 1 (YY1) expression in hepatocellular carcinoma (HCC) was analyzed using clinical specimens, and its roles in HCC in lipid metabolism were examined using gain- and loss-of function experiments. The mechanism of YY1 regulation on peroxisome proliferator-activated receptor gamma coactivator-1β (PGC-1β) and its downstream genes medium-chain acyl-CoA dehydrogenase (MCAD) and long-chain acyl-CoA dehydrogenase (LCAD) were investigated using molecular biology and biochemical methods. The role of YY1/ PGC-1β axis in hepatocarcinogenesis was studied using xenograft experiment. Results: This study showed that YY1 suppresses fatty acid β-oxidation, leading to increase of cellular triglyceride level and lipid accumulation in HCC cells, and subsequently induction of the tumorigenesis potential of HCC cells. Molecular mechanistic study revealed that YY1 blocks the expression of PGC-1β, an activator of fatty acid β-oxidation, by directly binding to its promoter; and thus downregulates PGC-1β/MCAD and PGC1-β/LCAD axis. Importantly, we revealed that YY1 inhibition on PGC-1β occurs irrespective of the expression of hypoxia-inducible factor-1α (HIF1-α), enabling it to promote lipid accumulation under both normoxic and hypoxic conditions. Conclusion: Our study reveals the critical role of YY1/PGC-1β axis in HCC cell lipid metabolism, providing novel insight into the molecular mechanisms associated with tumor cell lipid metabolism, and a new perspective regarding the function of YY1 in tumor progression. Thus, our study provides evidences regarding the potential of YY1 as a target for lipid metabolism-based anti-tumor therapy.
Keywords: PGC-1β; Yin Yang 1; fatty acid oxidation; hepatocellular carcinoma; lipid accumulation.
© The author(s).
Conflict of interest statement
Competing Interests: The authors have declared that no competing interest exists.
Figures
Figure 1
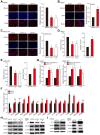
YY1 induces hepatocellular carcinoma (HCC) cell lipid accumulation by regulating MCAD and LCAD expression. A-B. The accumulation of lipid droplets in _YY1_-silenced (A) and _YY1_-overexpressed (B) HepG2 cells, as determined using Nile Red staining. Representative images (left) and relative fluorescence intensity (right, n = 9) are shown. C. The accumulation of lipid droplets in _YY1_-silenced MHCC-97H cells, as examined using Nile Red staining. Representative images (left) and relative fluorescence intensity (right, n = 9) are shown. D-E. The levels of cellular triglyceride (TG) in _YY1_-silenced and _YY1_-overexpressed HepG2 (D) and MHCC-97H (E) cells (n = 3). F. mRNA expression levels of various lipid metabolic-associated factors in _YY1_-silenced HepG2 cells, as determined using quantitative reverse-transcribed PCR (qRT-PCR). Representative data are shown (n = 3). G-H. mRNA (G) and protein (H) expression levels of MCAD and LCAD in _YY1_-silenced HepG2 and MHCC-97H cells, as determined using qRT-PCR (n = 3) and western blotting, respectively. I. Protein expression levels of MCAD and LCAD in _YY1_-overexpressed HepG2 and MHCC-97H cells, as determined using western blotting. All experiments were performed under hypoxic condition. Cells transfected with shCon or pcCon were used as controls. β-actin was used for qRT-PCR normalization and as western blotting loading control. Scale bars: 200 μm. Quantification data are shown as mean ± SEM of three independent experiments. pcCon: pcDNA3.1(+); *P < 0.05; **P < 0.01; NS: not significant (ANOVA).
Figure 2
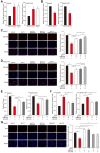
YY1 upregulates fatty acids β-oxidation by negatively regulates the expression of MCAD and LCAD at their transcriptional levels. A-B. The level of fatty acid β-oxidation in _YY1_-silenced (A) and _YY1_-overexpressed (B) HepG2 and MHCC-97H cells (n = 3). C-D. The accumulation of lipid droplets in YY1/MCAD- or YY1/_LCAD-_double silenced HepG2 (C) and MHCC-97H (D) cells, as examined using Nile Red staining. Representative images (left) and relative fluorescence intensity (right, n = 9) are shown. E-F. The levels of cellular TG (E) and fatty acid β-oxidation (F) in YY1/MCAD- or YY1/_LCAD-_double silenced HepG2 (left) and MHCC-97H (right) cells (n = 3). G. Number of proliferative YY1/MCAD- or YY1/_LCAD-_double silenced HepG2 cells, as determined by EdU incorporation assay. Representative images (left) and ratio of the EdU positive cells to the total cell number (right) are shown (n = 9). All experiments were performed under hypoxic condition. Cells transfected with shCon or pcCon were used as controls. Scale bars: 200 μm. Quantification data are shown as mean ± SEM of three independent experiments. pcCon: pcDNA3.1(+); *P < 0.05; **P < 0.01 (ANOVA).
Figure 3
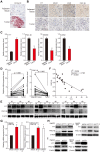
YY1 negatively regulates PGC-1β at the transcriptional level in HCC cell. A. The accumulation of lipid droplets in the clinical HCC tissue and the normal adjacent tissue, as analyzed using Oil Red O staining. Scale bars: 200 μm. B-C. The expression levels of YY1, MCAD, LCAD and PGC-1β in the clinical HCC tissue and the normal adjacent tissue, as analyzed by immunohistochemical staining using serial sections. Representative images (B) and the quantification results (C, n = 6) are shown. Scale bars: 40 μm. Quantification results are shown as relative to adjacent tissue. D-E. The mRNA (D, n = 18) and protein (E, n = 9) expression levels of YY1 and PGC-1β in clinical human HCC and the corresponding normal adjacent tissues. F. Correlation analysis between the mRNA expression levels of YY1 and PGC-1β in clinical HCC tissue. G-H. PGC-1β mRNA (G) and protein (H) expression levels in _YY1_-silenced HepG2 and MHCC-97H cells cultured under hypoxic condition, as determined using qRT-PCR (n = 3) and western blotting, respectively. I. PGC-1β protein expression levels in _YY1_-overexpressed HepG2 (left) and MHCC-97H (right) cells cultured under hypoxia, as determined using western blotting. Cells transfected with shCon or pcCon were used as controls. β-actin was used for qRT-PCR normalization and as western blotting loading control. Quantification data are shown as mean ± SEM of three independent experiments. pcCon: pcDNA3.1(+); **P < 0.01 (ANOVA).
Figure 4
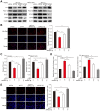
PGC-1β is critical for YY1-induced lipid accumulation in HCC cell. A. The protein expression levels of PGC-1β, MCAD and LCAD in YY1/_PGC-1β_-double silenced HepG2 (left) and MHCC-97H (right) cells, as examined using western blotting. B. The accumulation of lipid droplets in YY1/_PGC-1β_-double silenced HepG2 cells, as analyzed using Nile Red staining. Representative images (left) and relative fluorescence intensity (right, n = 9) are shown. C-D. The levels of cellular TG (C) and fatty acid β-oxidation (D) in YY1/_PGC-1β-_double silenced HepG2 (left) and MHCC-97H (right) cells (n = 3). E. Number of proliferative YY1/_PGC-1β-_double silenced HepG2 cells, as determined by EdU incorporation assay. Representative images (left) and ratio of the EdU positive cells to the total cell number (right) are shown (n = 9). All experiments were performed under hypoxic condition. Cells transfected with shCon were used as controls. β-actin was used as western blotting loading control. Quantification data are shown as mean ± SEM of three independent experiments. Scale bars: 200 μm. *P < 0.05; **P < 0.01 (ANOVA).
Figure 5
YY1 regulates HCC cell lipid accumulation in a HIF-1α independent pathway. A. Protein expression levels of PGC-1β, MCAD and LCAD in _HIF-1α-_silenced HepG2 cells overexpressing YY1 cultured under hypoxic condition, as examined using western blotting. B-C. mRNA (B) and protein (C) expression levels of PGC1-β, MCAD and LCAD in YY1/_PGC-1β-_double silenced HepG2 cells cultured under normoxic condition, as determined using qRT-PCR (n = 3) and western blotting, respectively. D. Protein expression level of PGC-1β, MCAD and LCAD in _YY1_-overexpressed _HIF-1α_-knocked out HepG2 cells (HepG2HIFnull) cultured under hypoxic condition, as determined using western blotting. E. The accumulation of lipid droplets in _YY1_-overexpressed HepG2HIFnull cells cultured under hypoxic condition, as analyzed using Nile Red staining. Representative images (left) and relative fluorescence intensity (right, n = 9) are shown. F. The level of cellular TG (left) and fatty acid β-oxidation (right) in _YY1_-overexpressed HepG2HIFnull cells cultured under hypoxic condition (n = 3). Cells transfected with shCon or pcCon were used as controls. β-actin was used for qRT-PCR normalization and as western blotting loading control. Quantification data are shown as mean ± SEM of three independent experiments. Scale bars: 200 μm. pcCon: pcDNA3.1(+); *P < 0.05; **P < 0.01 (ANOVA).
Figure 6
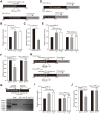
YY1 binds to PGC-1β promoter and enhances its transcription independently of HIF-1α. A. Schematic diagrams of the predicted YY1 binding site in PGC-1β promoter and the luciferase reporter bringing PGC-1β promoter (PGC-1β-Luc). B-C. The activity of PGC-1β-Luc in _YY1_-silenced (B) and _YY1-_overexpressed (C) HepG2 cells cultured under normoxic condition, as analyzed by using dual luciferase assay (n = 3). D. Schematic diagram of firefly luciferase reporter bringing the PGC-1β promoter lacking YY1 binding site (PGC-1βdel-Luc). E-F. The activities of PGC-1β-Luc and PGC-1βdel-Luc in _YY1_-silenced (E) and _YY1_-overexpressed (F) HepG2HIFnull cells cultured under hypoxic condition, as analyzed using dual luciferase assay (n = 3). G. Binding of YY1 to the promoter region of PGC-1β in HepG2 cells as examined using chromatin immunoprecipitation assay with anti-YY1 antibody followed by PCR. Location of the primer set (top) and the length of the amplicon (bottom) are shown. H. Schematic diagram of the firefly luciferase reporter bringing PGC-1β promoter with mutated predicted YY1 binding site (PGC-1βMut-Luc). Wild-type nucleotides are shown in black, and mutated ones are shown in gray. I-J. The activities of PGC-1β-Luc and PGC-1βMut-Luc in _YY1_-silenced (I) and _YY1_-overexpressed (J) HepG2HIFnull cells cultured under hypoxic condition, as analyzed using dual luciferase assay (n = 3). Cells transfected with shCon or pcCon were used as controls. Quantification data are shown as mean ± SEM of three independent experiments. pcCon: pcDNA3.1(+); **P < 0.01; NS: not significant (ANOVA).
Figure 7
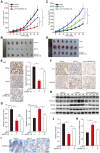
YY1 mediates hepatocarcinogenesis potential by negatively regulates PGC-1β. A-B. Hepatocarcinogenesis potential of control (shCon), _YY1_-silenced (shYY1) and _YY1/PGC-1β_-double silenced (shYY1/shPGC-1β) MHCC-97H stable cell lines were examined in vivo by subcutaneous injection into Balb/c-nu/nu mice (n = 6). Volume of the tumors formed at indicated time points (A) and the appearance (B) are shown. C-D. Hepatocarcinogenesis potential of control (Cont), _YY1_-overexpressed (pcYY1) and _YY1/PGC-1β_-double overexpressed (pcYY1/pcPGC-1β) MHCC-97H stable cell lines were examined in vivo by subcutaneous injection into Balb/c-nu/nu mice (n = 6). Volume of the tumors formed at indicated time points (C) and the appearance (D) are shown. E. Proliferative cells in the tissue section of xenografted tumors in Balb/c-nu/nu mice injected with the indicated cell lines, as stained using Ki67. Scale bars: 40 μm. Representative images (left) and quantification results (right, n = 6) are shown. F-G. Immunohistochemical staining images against YY1 (top) and PGC-1β (bottom) in the tissue section of xenografted tumors in Balb/c-nu/nu mice injected with the indicated cell lines. Scale bars: 40 μm. Representative images (F) and relative expression level (G) are shown (n = 6). Quantification was performed by counting the ratio of the positive cells to total cell number, and the results are shown as relative to control. H. YY1, PGC1-β, MCAD and LCAD protein expression levels in the xenografted tumors in Balb/c-nu/nu mice injected with the indicated cell lines were examined using western blotting. I. The accumulation of lipid droplets in the tissue section of xenografted tumors in Balb/c-nu/nu mice injected with the indicated cell lines were stained using Oil Red O staining. J-K. The level of cellular TG (J) and fatty acid β-oxidation (K) in the xenografted tumors in Balb/c-nu/nu mice injected with the indicated cell lines. Cells transfected with shCon or pcEF9-puro were used as controls. β-actin was used as western blotting loading control. Quantification data are shown as mean ± SEM of three independent experiments. **P < 0.01; NS: not significant (ANOVA).
Figure 8
Schematic diagram showing the mechanism of YY1/PGC-1β axis-mediated HCC cells lipid metabolism in both normoxia and hypoxia.
Similar articles
- Hepatic peroxisome proliferator-activated receptor γ coactivator 1β drives mitochondrial and anabolic signatures that contribute to hepatocellular carcinoma progression in mice.
Piccinin E, Peres C, Bellafante E, Ducheix S, Pinto C, Villani G, Moschetta A. Piccinin E, et al. Hepatology. 2018 Mar;67(3):884-898. doi: 10.1002/hep.29484. Epub 2018 Jan 29. Hepatology. 2018. PMID: 28857232 - Yin Yang 1-mediated epigenetic silencing of tumour-suppressive microRNAs activates nuclear factor-κB in hepatocellular carcinoma.
Tsang DP, Wu WK, Kang W, Lee YY, Wu F, Yu Z, Xiong L, Chan AW, Tong JH, Yang W, Li MS, Lau SS, Li X, Lee SD, Yang Y, Lai PB, Yu DY, Xu G, Lo KW, Chan MT, Wang H, Lee TL, Yu J, Wong N, Yip KY, To KF, Cheng AS. Tsang DP, et al. J Pathol. 2016 Apr;238(5):651-64. doi: 10.1002/path.4688. J Pathol. 2016. PMID: 26800240 - Suppression of ACADM-Mediated Fatty Acid Oxidation Promotes Hepatocellular Carcinoma via Aberrant CAV1/SREBP1 Signaling.
Ma APY, Yeung CLS, Tey SK, Mao X, Wong SWK, Ng TH, Ko FCF, Kwong EML, Tang AHN, Ng IO, Cai SH, Yun JP, Yam JWP. Ma APY, et al. Cancer Res. 2021 Jul 1;81(13):3679-3692. doi: 10.1158/0008-5472.CAN-20-3944. Epub 2021 May 11. Cancer Res. 2021. PMID: 33975883 - The Yin and Yang of YY1 in tumor growth and suppression.
Khachigian LM. Khachigian LM. Int J Cancer. 2018 Aug 1;143(3):460-465. doi: 10.1002/ijc.31255. Epub 2018 Jan 31. Int J Cancer. 2018. PMID: 29322514 Review. - Regulation of energy metabolism by long-chain fatty acids.
Nakamura MT, Yudell BE, Loor JJ. Nakamura MT, et al. Prog Lipid Res. 2014 Jan;53:124-44. doi: 10.1016/j.plipres.2013.12.001. Epub 2013 Dec 18. Prog Lipid Res. 2014. PMID: 24362249 Review.
Cited by
- Cistrome analysis of YY1 uncovers a regulatory axis of YY1:BRD2/4-PFKP during tumorigenesis of advanced prostate cancer.
Xu C, Tsai YH, Galbo PM, Gong W, Storey AJ, Xu Y, Byrum SD, Xu L, Whang YE, Parker JS, Mackintosh SG, Edmondson RD, Tackett AJ, Huang J, Zheng D, Earp HS, Wang GG, Cai L. Xu C, et al. Nucleic Acids Res. 2021 May 21;49(9):4971-4988. doi: 10.1093/nar/gkab252. Nucleic Acids Res. 2021. PMID: 33849067 Free PMC article. - BZW2/5MP1 acts as a promising target in hepatocellular carcinoma.
Li G, Lu A, Chen A, Geng S, Xu Y, Chen X, Yang J. Li G, et al. J Cancer. 2021 Jun 22;12(17):5125-5135. doi: 10.7150/jca.53282. eCollection 2021. J Cancer. 2021. PMID: 34335929 Free PMC article. - Peroxisome proliferator-activated receptor gamma coactivator-1 (PGC-1) family in physiological and pathophysiological process and diseases.
Qian L, Zhu Y, Deng C, Liang Z, Chen J, Chen Y, Wang X, Liu Y, Tian Y, Yang Y. Qian L, et al. Signal Transduct Target Ther. 2024 Mar 1;9(1):50. doi: 10.1038/s41392-024-01756-w. Signal Transduct Target Ther. 2024. PMID: 38424050 Free PMC article. Review. - Immune-related biomarkers shared by inflammatory bowel disease and liver cancer.
Nguyen TB, Do DN, Nguyen TTP, Nguyen TL, Nguyen-Thanh T, Nguyen HT. Nguyen TB, et al. PLoS One. 2022 Apr 22;17(4):e0267358. doi: 10.1371/journal.pone.0267358. eCollection 2022. PLoS One. 2022. PMID: 35452485 Free PMC article. - Unspliced XBP1 contributes to cholesterol biosynthesis and tumorigenesis by stabilizing SREBP2 in hepatocellular carcinoma.
Wei M, Nurjanah U, Herkilini A, Huang C, Li Y, Miyagishi M, Wu S, Kasim V. Wei M, et al. Cell Mol Life Sci. 2022 Aug 6;79(9):472. doi: 10.1007/s00018-022-04504-x. Cell Mol Life Sci. 2022. PMID: 35933495 Free PMC article.
References
- Lin YH, Wu MH, Huang YH, Yeh CT, Cheng ML, Chi HC. et al. Taurine up-regulated gene 1 functions as a master regulator to coordinate glycolysis and metastasis in hepatocellular carcinoma. Hepatology. 2018;67:188–203. - PubMed
- Schulze A, Harris AL. How cancer metabolism is tuned for proliferation and vulnerable to disruption. Nature. 2012;491:364–73. - PubMed
Publication types
MeSH terms
Substances
LinkOut - more resources
Full Text Sources
Medical
