Molecular, endoscopic, histologic, and circulating biomarker-based diagnosis of eosinophilic gastritis: Multi-site study - PubMed (original) (raw)
Clinical Trial
. 2020 Jan;145(1):255-269.
doi: 10.1016/j.jaci.2019.11.007. Epub 2019 Nov 16.
Ting Wen 1, Julie M Caldwell 1, Margaret H Collins 2, John A Besse 1, Garrett A Osswald 1, J Pablo Abonia 1, Nicoleta C Arva 3, Dan Atkins 4, Kelley E Capocelli 5, Evan S Dellon 6, Gary W Falk 7, Nirmala Gonsalves 8, Sandeep K Gupta 9, Ikuo Hirano 8, Vincent A Mukkada 10, Philip E Putnam 10, Rachel M Sheridan 2, Amanda K Rudman Spergel 11, Jonathan M Spergel 12, Joshua B Wechsler 13, Guang-Yu Yang 14, Seema S Aceves 15, Glenn T Furuta 16, Marc E Rothenberg 17; Consortium of Eosinophilic Gastrointestinal Disease Researchers (CEGIR)
Affiliations
- PMID: 31738990
- PMCID: PMC6949389
- DOI: 10.1016/j.jaci.2019.11.007
Clinical Trial
Molecular, endoscopic, histologic, and circulating biomarker-based diagnosis of eosinophilic gastritis: Multi-site study
Tetsuo Shoda et al. J Allergy Clin Immunol. 2020 Jan.
Abstract
Background: Eosinophilic gastritis (EG) is a clinicopathologic disorder with marked gastric eosinophilia and clinical symptoms. There is an unmet need among patients with EG for more precise diagnostic tools.
Objective: We aimed to develop tissue- and blood-based diagnostic platforms for EG.
Methods: Patients with EG and control subjects without EG were enrolled across 9 Consortium of Eosinophilic Gastrointestinal Disease Researchers-associated sites. An EG Diagnostic Panel (EGDP; gastric transcript subset) and EG blood biomarker panel (protein multiplex array) were analyzed. EGDP18 scores were derived from the expression of 18 highly dysregulated genes, and blood EG scores were derived from dysregulated cytokine/chemokine levels.
Results: Gastric biopsy specimens and blood samples from 185 subjects (patients with EG, n = 74; control subjects without EG, n = 111) were analyzed. The EGDP (1) identified patients with active EG (P < .0001, area under the curve ≥ 0.95), (2) effectively monitored disease activity in longitudinal samples (P = .0078), (3) highly correlated in same-patient samples (antrum vs body, r = 0.85, P < .0001), and (4) inversely correlated with gastric peak eosinophil levels (r = -0.83, P < .0001), periglandular circumferential collars (r = -0.73, P < .0001), and endoscopic nodularity (r = -0.45, P < .0001). For blood-based platforms, eotaxin-3, thymus and activation-regulated chemokine, IL-5, and thymic stromal lymphopoietin levels were significantly increased. Blood EG scores (1) distinguished patients with EG from control subjects without EG (P < .0001, area under the curve ≥ 0.91), (2) correlated with gastric eosinophil levels (plasma: r = 0.72, P = .0002; serum: r = 0.54, P = .0015), and (3) inversely correlated with EGDP18 scores (plasma: r = -0.64, P = .0015; serum: r = -0.46, P = .0084). Plasma eotaxin-3 levels strongly associated with gastric CCL26 expression (r = 0.81, P < .0001).
Conclusion: We developed tissue- and blood-based platforms for assessment of EG and uncovered robust associations between specific gastric molecular profiles and histologic and endoscopic features, providing insight and clinical readiness tools for this emerging rare disease.
Keywords: Biomarker; diagnostic panel; eosinophil; eosinophilic gastritis; transcriptome.
Copyright © 2019 American Academy of Allergy, Asthma & Immunology. All rights reserved.
Conflict of interest statement
Conflicts of Interest
All other authors declare that they have no competing interests.
Figures
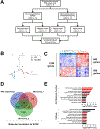
FIG 1.. Schematic illustration of the study and genome-wide screening of gastric tissue for identifying representative biomarkers
A, Flow chart of the study design and strategy. B, The gastric transcriptome data on non-EG controls (blue) and patients with EG (red) were reduced to 3-dimensional presentation by multidimensional scaling analysis at the whole-genome level for visual presentation of the expression distance between samples. C, Heat map (red, upregulated; blue, downregulated) of 1,226 differentially dysregulated genes’ expression profiles (FDR P < .05, ≥2-fold change). Clustering analysis was performed; each column represents an individual patient or control. D, Venn diagram comparing the number of genes identified as dysregulated in EG across different platforms. E, Functional enrichment gene ontology analysis of the strongly upregulated genes (FDR P < .01, ≥10-fold change). The x-axes represent the negative log10 FDR P value. Red bars indicate cytokine/chemokine-associated terms and pathways. EG, eosinophilic gastritis; EGDP, eosinophilic gastritis diagnostic panel; FDR, false-discovery rate; GO, gene ontology.
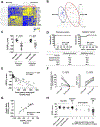
FIG 2.. Development of tissue-based platform (EGDP) and EGDP18 score on the basis of differentially expressed genes
A, Heat map (yellow, upregulated; blue, downregulated) based on the 18 core genes (FDR P < .01 and fold change ≥10-fold change) in the discovery cohort. B, Three-dimensional presentation by PCA between samples on the basis of the 18 core genes (blue, non-EG controls; red, patients with EG). C, Comparison of the EGDP18 score between EG and non-EG in discovery and validation cohort. D, ROC curve analysis showing the utility of the EGDP18 score for the diagnosis of EG. E, Correlation between peak gastric eosinophil counts and EGDP18 score. F, Longitudinal changes of peak gastric eosinophil counts and EGDP18 score in patients with EG at active and inactive state. G, Correlation of EGDP18 score between the gastric antrum and body mucosa from the same subjects. H, EGDP18 score as a function of different patient groups, including patients with EG with involvement of 1–5 HPFs. AUC; area under the curve; EG, eosinophilic gastritis; EGDP, eosinophilic gastritis diagnostic panel; FDR, false-discovery rate; HPF, high-power field; NPV, negative predictive value; PCA, principal component analysis; PPV, positive predictive value; ROC, receiver operating characteristic.
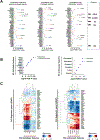
FIG 3.. Gastric transcript associations with histologic and endoscopic features
A, Associations between the individual genes of EGDP and diagnostic parameters. Negative log10 FDR P value of the Spearman correlation between the individual genes of EGDP and peak gastric eosinophil counts (left), histologic severity (middle), and the overall assessment of endoscopic severity (right). Red indicates a positive correlation and blue indicates a negative correlation. The dashed line indicates an FDR P value of .05. The top genes and features are labeled. B, Associations between the EGDP18 score and the individual components of histology (left) and endoscopy (right). C, Associations between the EGDP and the histologic (left) and endoscopic (right) features. Clustering tree with Spearman r–based heat diagram for the correlation at the gene level were generated. Darker red shades indicate stronger positive correlations, whereas darker blue shades indicate stronger negative correlations. The shorter the distance (tree-branch length) the more similar the expression correlation is for each feature. EG, eosinophilic gastritis; FDR, false-discovery rate; AIC, acute inflammatory cells; EoG, eosinophil glandulitis; EoGA, eosinophil gland abscess; EoM, eosinophils in muscularis mucosa; EoSE, eosinophils in surface epithelium; LPES, lamina propria eosinophil sheets; LPF, lamina propria fibroplasia; LPSMH, lamina propria smooth muscle hyperplasia; PCC, periglandular circumferential collars; REC, reactive epithelial changes; SEU, surface erosion/ulceration.
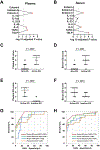
FIG 4.. Development of blood-based platforms via a multiplex protein array
A and B, Among the 10 biomarkers embedded in the platform, a statistical screening was performed between the non-EG subjects and patients with EG in the (A) plasma and (B) serum cohort, separately, resulting in 3 biomarkers (red) with adjusted P < .05 (Bonferroni correction). C and D, Levels of blood EG scores in patients with active EG (C, plasma; D, serum). E and F, Blood EG scores in patients with active EG and inactive EG (E, plasma; F, serum). G and H, ROC curves and performance of blood EG scores. The AUC was calculated for 4 conditions: (G) Plasma cohort; plasma EG score, eotaxin-3, IL-5, and TARC. (H) Serum cohort; serum EG score, eotaxin-3, IL-5, and TSLP. AUC; area under the curve; EG, eosinophilic gastritis; NPV, negative predictive value; PCA, principal component analysis; PPV, positive predictive value; ROC, receiver operating characteristic.
FIG 5.. Associations among the local and systemic features
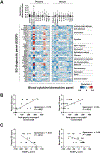
A, Associations between the EGDP and the blood cytokine/chemokines. Using Spearman r for the correlation between the EGDP gene expressions and (left) plasma and (right) serum cytokine/chemokines, the magnitudes of correlation with the EGDP are shown (upper). A Spearman r–based heat diagram for the correlation at the gene level are shown ( lower). Genes shown on the y axis are organized within functional groupings. Darker red shades indicate stronger positive correlations, whereas darker blue shades indicate stronger negative correlations. B, Correlation between blood EG score (left, plasma; right, serum) and peak gastric eosinophil counts, with Spearman r and P values shown. C, Correlation between blood EG scores (left, plasma; right, serum) and the EGDP18 score, with Spearman r and P values shown. EG, eosinophilic gastritis; EGDP, eosinophilic gastritis diagnostic panel; EMT, epithelial-mesenchymal transition; HPF, high-power field. *P < .01 vs. all other proteins.
Similar articles
- Histologic eosinophilic gastritis is a systemic disorder associated with blood and extragastric eosinophilia, TH2 immunity, and a unique gastric transcriptome.
Caldwell JM, Collins MH, Stucke EM, Putnam PE, Franciosi JP, Kushner JP, Abonia JP, Rothenberg ME. Caldwell JM, et al. J Allergy Clin Immunol. 2014 Nov;134(5):1114-24. doi: 10.1016/j.jaci.2014.07.026. Epub 2014 Sep 15. J Allergy Clin Immunol. 2014. PMID: 25234644 Free PMC article. Clinical Trial. - Association Between Endoscopic and Histologic Findings in a Multicenter Retrospective Cohort of Patients with Non-esophageal Eosinophilic Gastrointestinal Disorders.
Pesek RD, Reed CC, Collins MH, Muir AB, Fulkerson PC, Menard-Katcher C, Falk GW, Kuhl J, Magier AZ, Ahmed FN, Demarshall M, Gupta A, Gross J, Ashorobi T, Carpenter CL, Krischer JP, Gonsalves N, Hirano I, Spergel JM, Gupta SK, Furuta GT, Rothenberg ME, Dellon ES; Consortium of Eosinophilic Gastrointestinal Disease Researchers (CEGIR). Pesek RD, et al. Dig Dis Sci. 2020 Jul;65(7):2024-2035. doi: 10.1007/s10620-019-05961-4. Epub 2019 Nov 26. Dig Dis Sci. 2020. PMID: 31773359 Free PMC article. - Prospective Endoscopic Activity Assessment for Eosinophilic Gastritis in a Multisite Cohort.
Hirano I, Collins MH, King E, Sun Q, Chehade M, Abonia JP, Bonis PA, Capocelli KE, Dellon ES, Falk GW, Gonsalves N, Gupta SK, Leung J, Katzka D, Menard-Katcher P, Khoury P, Klion A, Mukkada VA, Peterson K, Shoda T, Rudman-Spergel AK, Spergel JA, Yang GY, Rothenberg ME, Aceves SS, Furuta GT; CEGIR investigators. Hirano I, et al. Am J Gastroenterol. 2022 Mar 1;117(3):413-423. doi: 10.14309/ajg.0000000000001625. Am J Gastroenterol. 2022. PMID: 35080202 Free PMC article. - Eosinophilic gastroenteritis presenting as upper gastrointestinal hematoma and ulcers after endoscopic biopsy: A case report and literature review.
Chen B, Yang Z, Lu H, Wei C, Wang F, Liu C. Chen B, et al. Medicine (Baltimore). 2017 Sep;96(37):e8075. doi: 10.1097/MD.0000000000008075. Medicine (Baltimore). 2017. PMID: 28906408 Free PMC article. Review. - Eosinophilic gastroenteritis: epidemiology, diagnosis, and treatment.
Kinoshita Y, Ishihara S. Kinoshita Y, et al. Curr Opin Allergy Clin Immunol. 2020 Jun;20(3):311-315. doi: 10.1097/ACI.0000000000000635. Curr Opin Allergy Clin Immunol. 2020. PMID: 32073433 Review.
Cited by
- Advances in omics data for eosinophilic esophagitis: moving towards multi-omics analyses.
Matsuyama K, Yamada S, Sato H, Zhan J, Shoda T. Matsuyama K, et al. J Gastroenterol. 2024 Nov;59(11):963-978. doi: 10.1007/s00535-024-02151-6. Epub 2024 Sep 19. J Gastroenterol. 2024. PMID: 39297956 Free PMC article. Review. - Gastroenterology Practice Patterns Contribute to Missed Diagnoses of Eosinophilic Gastritis and Duodenitis.
Chehade M, Tan J, Gehman LT. Chehade M, et al. Gastro Hep Adv. 2022 Nov 25;2(3):334-342. doi: 10.1016/j.gastha.2022.11.010. eCollection 2023. Gastro Hep Adv. 2022. PMID: 39132645 Free PMC article. - Examining the Role of Type 2 Inflammation in Eosinophilic Esophagitis.
Chehade M, Falk GW, Aceves S, Lee JK, Mehta V, Leung J, Shumel B, Jacob-Nara JA, Deniz Y, Rowe PJ, Cunoosamy D, Khodzhayev A. Chehade M, et al. Gastro Hep Adv. 2022 May 21;1(5):720-732. doi: 10.1016/j.gastha.2022.05.004. eCollection 2022. Gastro Hep Adv. 2022. PMID: 39131849 Free PMC article. Review. - The Natural History of Eosinophilic Gastrointestinal Diseases Is Influenced by Age of Onset and Location of Involvement.
Ketchem CJ, Reed CC, Dellon ES. Ketchem CJ, et al. Am J Gastroenterol. 2024 May 16:10.14309/ajg.0000000000002869. doi: 10.14309/ajg.0000000000002869. Online ahead of print. Am J Gastroenterol. 2024. PMID: 38752626 - Common and disparate clinical presentations and mechanisms in different eosinophilic gastrointestinal diseases.
Shoda T, Taylor RJ, Sakai N, Rothenberg ME. Shoda T, et al. J Allergy Clin Immunol. 2024 Jun;153(6):1472-1484. doi: 10.1016/j.jaci.2024.03.013. Epub 2024 Mar 28. J Allergy Clin Immunol. 2024. PMID: 38555071 Review.
References
- Rothenberg ME. Eosinophilic gastrointestinal disorders (EGID). J Allergy Clin Immunol 2004; 113:11–28. - PubMed
- Walker MM, Potter M, Talley NJ. Eosinophilic gastroenteritis and other eosinophilic gut diseases distal to the oesophagus. The Lancet Gastroenterology & Hepatology 2018; 3:271–80. - PubMed
- Pesek RD, Reed CC, Muir AB, Fulkerson PC, Menard-Katcher C, Falk GW, et al. Increasing Rates of Diagnosis, Substantial Co-Occurrence, and Variable Treatment Patterns of Eosinophilic Gastritis, Gastroenteritis, and Colitis Based on 10-Year Data Across a Multicenter Consortium. Am J Gastroenterol 2019; 114:984–94. - PMC - PubMed
Publication types
MeSH terms
Substances
Supplementary concepts
LinkOut - more resources
Full Text Sources
Other Literature Sources
Medical
