Surface ocean pH and buffer capacity: past, present and future - PubMed (original) (raw)
Surface ocean pH and buffer capacity: past, present and future
Li-Qing Jiang et al. Sci Rep. 2019.
Abstract
The ocean's chemistry is changing due to the uptake of anthropogenic carbon dioxide (CO2). This phenomenon, commonly referred to as "Ocean Acidification", is endangering coral reefs and the broader marine ecosystems. In this study, we combine a recent observational seawater CO2 data product, i.e., the 6th version of the Surface Ocean CO2 Atlas (1991-2018, ~23 million observations), with temporal trends at individual locations of the global ocean from a robust Earth System Model to provide a high-resolution regionally varying view of global surface ocean pH and the Revelle Factor. The climatology extends from the pre-Industrial era (1750 C.E.) to the end of this century under historical atmospheric CO2 concentrations (pre-2005) and the Representative Concentrations Pathways (post-2005) of the Intergovernmental Panel on Climate Change (IPCC)'s 5th Assessment Report. By linking the modeled pH trends to the observed modern pH distribution, the climatology benefits from recent improvements in both model design and observational data coverage, and is likely to provide improved regional OA trajectories than the model output could alone, therefore, will help guide the regional OA adaptation strategies. We show that air-sea CO2 disequilibrium is the dominant mode of spatial variability for surface pH, and discuss why pH and calcium carbonate mineral saturation states, two important metrics for OA, show contrasting spatial variability.
Conflict of interest statement
The authors declare no competing interests.
Figures
Figure 1
Climatological distribution of global surface ocean pH on the total hydrogen scale (pHT) at in-situ temperature. The pHT values are annually averaged and adjusted to be approximate for the year 2000. Panel a, surface pHT based on the 6th version of the Surface Ocean CO2 Atlas (SOCATv6). Panel b, surface pHT based on the 2nd version of the Global Ocean Data Analysis Project (GLODAPv2).
Figure 2
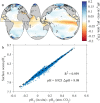
Surface ocean pHT variation caused by air-sea CO2 disequilibria. Panel a, the spatial distribution of the pH caused by air-sea disequilibria. pHT (atm. CO2) is the pH if the water were to be equilibrated with the atmospheric CO2 level in 2000. Panel b, the regression between surface pHT and the pH caused by air-sea disequilibria based on the original discrete pH data (before gridding).
Figure 3
Spatial distribution of global surface ocean pHT in 1770. Panel a, the annually-averaged surface ocean pHT adjusted to be approximate for the year 1770. Panel b, the difference between pHT in 2000 and 1770 (pH2000 – pH1770) in the global surface ocean.
Figure 4
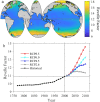
Spatial and temporal distributions of global surface ocean Revelle Factor. Panel a, the spatial distribution of annually-averaged Revelle Factor adjusted for the year 2000 in the global surface ocean. Panel b, the long-term change of the globally and annually-averaged surface Revelle Factor from 1770 to 2100 under all Representative Concentrations Pathway (RCP) scenarios.
Figure 5
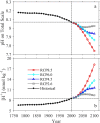
Long-term change of global surface ocean pHT and ocean acidity. Panel a, the globally and annually-averaged surface ocean pHT from 1770 to 2100. Panel b, the change of ocean acidity (hydrogen ion activity, [H+], 1 nmol kg−1 = 1×10⁻⁹ mol kg−1) over the same period.
Figure 6
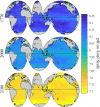
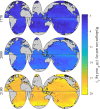
Spatial distribution of global surface ocean pHT (total hydrogen scale, annually averaged) in past (1770), present (2000) and future (2100) under the IPCC RCP8.5 scenario.
Figure 7
Spatial distribution of global surface ocean acidity (hydrogen ion activity, annually averaged) in past (1770), present (2000) and future (2100) under the IPCC RCP8.5 Scenario.
Figure 8
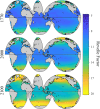
Spatial distribution of global surface ocean Revelle Factor (annually averaged) in past (1770), present (2000) and future (2100) under the IPCC RCP8.5 scenario.
Similar articles
- Response of ocean acidification to atmospheric carbon dioxide removal.
Jiang J, Cao L, Jin X, Yu Z, Zhang H, Fu J, Jiang G. Jiang J, et al. J Environ Sci (China). 2024 Jun;140:79-90. doi: 10.1016/j.jes.2023.04.029. Epub 2023 May 4. J Environ Sci (China). 2024. PMID: 38331517 - Future ocean hypercapnia driven by anthropogenic amplification of the natural CO2 cycle.
McNeil BI, Sasse TP. McNeil BI, et al. Nature. 2016 Jan 21;529(7586):383-6. doi: 10.1038/nature16156. Nature. 2016. PMID: 26791726 - Defining CO2 and O2 syndromes of marine biomes in the Anthropocene.
Klein SG, Steckbauer A, Duarte CM. Klein SG, et al. Glob Chang Biol. 2020 Feb;26(2):355-363. doi: 10.1111/gcb.14879. Epub 2019 Nov 19. Glob Chang Biol. 2020. PMID: 31637801 - Ocean acidification refugia in variable environments.
Kapsenberg L, Cyronak T. Kapsenberg L, et al. Glob Chang Biol. 2019 Oct;25(10):3201-3214. doi: 10.1111/gcb.14730. Epub 2019 Jul 30. Glob Chang Biol. 2019. PMID: 31199553 Free PMC article. Review. - Biochemical adaptation to ocean acidification.
Stillman JH, Paganini AW. Stillman JH, et al. J Exp Biol. 2015 Jun;218(Pt 12):1946-55. doi: 10.1242/jeb.115584. J Exp Biol. 2015. PMID: 26085671 Review.
Cited by
- Linking Electronic Relaxation Dynamics and Ionic Photofragmentation Patterns for the Deprotonated UV Filter Benzophenone-4.
Wong NGK, Rankine CD, Dessent CEH. Wong NGK, et al. J Phys Chem Lett. 2021 Mar 25;12(11):2831-2836. doi: 10.1021/acs.jpclett.1c00423. Epub 2021 Mar 15. J Phys Chem Lett. 2021. PMID: 33719458 Free PMC article. - An Integrative Bioinformatic Analysis for Keratinase Detection in Marine-Derived Streptomyces.
Valencia R, González V, Undabarrena A, Zamora-Leiva L, Ugalde JA, Cámara B. Valencia R, et al. Mar Drugs. 2021 May 21;19(6):286. doi: 10.3390/md19060286. Mar Drugs. 2021. PMID: 34063876 Free PMC article. - What are the toxicity thresholds of chemical pollutants for tropical reef-building corals? A systematic review.
Ouédraogo DY, Mell H, Perceval O, Burga K, Domart-Coulon I, Hédouin L, Delaunay M, Guillaume MMM, Castelin M, Calvayrac C, Kerkhof O, Sordello R, Reyjol Y, Ferrier-Pagès C. Ouédraogo DY, et al. Environ Evid. 2023 Mar 19;12(1):4. doi: 10.1186/s13750-023-00298-y. Environ Evid. 2023. PMID: 39294817 Free PMC article. - Feedbacks Between Estuarine Metabolism and Anthropogenic CO2 Accelerate Local Rates of Ocean Acidification and Hasten Threshold Exceedances.
Pacella SR, Brown CA, Labiosa RG, Hales B, Collura TCM, Evans W, Waldbusser GG. Pacella SR, et al. J Geophys Res Oceans. 2024 Feb 27;129(3):e2023JC020313. doi: 10.1029/2023jc020313. J Geophys Res Oceans. 2024. PMID: 39391375 - Contrasting marine carbonate systems in two fjords in British Columbia, Canada: Seawater buffering capacity and the response to anthropogenic CO2 invasion.
Hare A, Evans W, Pocock K, Weekes C, Gimenez I. Hare A, et al. PLoS One. 2020 Sep 3;15(9):e0238432. doi: 10.1371/journal.pone.0238432. eCollection 2020. PLoS One. 2020. PMID: 32881918 Free PMC article.
References
- Feely RA, Doney SC, Cooley SR. Ocean Acidification: Present conditions and future changes in a high-CO2 world. Oceanography. 2009;22:36–47. doi: 10.5670/oceanog.2009.95. - DOI
- Khatiwala S, et al. Global ocean storage of anthropogenic carbon. Biogeosciences. 2013;10:2169–2191. doi: 10.5194/bg-10-2169-2013. - DOI
- Ussiri D. A. & Lal, R. The Global Carbon Inventory. Carbon Sequestration for Climate Change Mitigation and Adaptation (Springer, Cham, 2017).
Publication types
LinkOut - more resources
Full Text Sources
Miscellaneous

