scRNA-seq assessment of the human lung, spleen, and esophagus tissue stability after cold preservation - PubMed (original) (raw)
doi: 10.1186/s13059-019-1906-x.
A Wilbrey-Clark 1, R J Miragaia 1, K Saeb-Parsy 3, K T Mahbubani 3, N Georgakopoulos 3, P Harding 1, K Polanski 1, N Huang 1, K Nowicki-Osuch 4, R C Fitzgerald 4, K W Loudon 5, J R Ferdinand 5, M R Clatworthy 5, A Tsingene 1, S van Dongen 1, M Dabrowska 1, M Patel 1, M J T Stubbington 1 6, S A Teichmann 1, O Stegle 2, K B Meyer 7
Affiliations
- PMID: 31892341
- PMCID: PMC6937944
- DOI: 10.1186/s13059-019-1906-x
scRNA-seq assessment of the human lung, spleen, and esophagus tissue stability after cold preservation
E Madissoon et al. Genome Biol. 2019.
Abstract
Background: The Human Cell Atlas is a large international collaborative effort to map all cell types of the human body. Single-cell RNA sequencing can generate high-quality data for the delivery of such an atlas. However, delays between fresh sample collection and processing may lead to poor data and difficulties in experimental design.
Results: This study assesses the effect of cold storage on fresh healthy spleen, esophagus, and lung from ≥ 5 donors over 72 h. We collect 240,000 high-quality single-cell transcriptomes with detailed cell type annotations and whole genome sequences of donors, enabling future eQTL studies. Our data provide a valuable resource for the study of these 3 organs and will allow cross-organ comparison of cell types. We see little effect of cold ischemic time on cell yield, total number of reads per cell, and other quality control metrics in any of the tissues within the first 24 h. However, we observe a decrease in the proportions of lung T cells at 72 h, higher percentage of mitochondrial reads, and increased contamination by background ambient RNA reads in the 72-h samples in the spleen, which is cell type specific.
Conclusions: In conclusion, we present robust protocols for tissue preservation for up to 24 h prior to scRNA-seq analysis. This greatly facilitates the logistics of sample collection for Human Cell Atlas or clinical studies since it increases the time frames for sample processing.
Keywords: Esophagus; Human; Ischemic time; Lung; Single-cell RNA sequencing; Spleen.
Conflict of interest statement
MJTS has been employed by 10x Genomics since April 2018; this employment had no bearing on this work. RJM has been employed by MedImmune/AstraZeneca since October 2018; this employment had no bearing on this work. The other authors declare that they have no competing interests.
Figures
Fig. 1
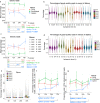
scRNA-seq quality metrics remain stable for at least 24 h of cold storage. a Experimental design: samples from the lung, esophagus, and spleen were collected from 5 or 6 donors each and stored as whole organ pieces at 4 °C for different time points prior to tissue processing for scRNA-seq and bulk RNA-seq. b–e Change of quality metrics of scRNA-seq data obtained with time, showing the b number of reads per sample, c number of cells per sample, d median number of genes detected per cell, and e number of genes confidently mapped to the transcriptome
Fig. 2
Exploration of loss of data quality with time in the spleen compared to other organs. a Violin plot of good quality reads mapped to exons in the spleen, b mean percentage of good quality exonic reads in all organs, c violin plot of good quality reads per exon in the spleen, d mean percentage of intronic reads across all organs, e box plot of percentage of mitochondrial reads in the spleen, f mean percentage of mitochondrial reads across all organs, and e percentage of cells with greater than 10% mitochondrial reads. The tissue of origin is indicated by color
Fig. 3
Loss of data quality is associated with increased “ambient RNA” and “debris” reads in the data. a Average spread of normalized UMI counts per droplet in the spleen, which were classified into ambient RNA, debris, and cellular material. b Mean values of normalized UMI in droplets containing debris or c cellular material. Individual sample means are shown for each donor with corresponding shape; color represents tissue. Means across donors per time point are shown by filled circles; whiskers represent standard deviation. p values were gained by Student’s paired (T0 vs 72 h) and non-paired (T0 vs 24 h) t test
Fig. 4
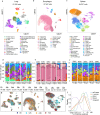
Cell types identified in different organs with time a UMAP projections of scRNA-seq data for the lung (n = 57,020), b esophagus (n = 87,947), and c spleen (n = 94,257). d–f Proportions of cells identified per donor and per time point for the d lung, e esophagus, and f spleen. g–j The single-cell UMAP plots for each organ with length of storage time highlighted. j Percent variance explained in the combined dataset by cell types, n counts, donor, tissue, and time points
Fig. 5
Cell type-specific changes in transcriptome. a Proportion of mitochondrial reads relative to T0 calculated for the spleen, esophagus, and lung. The fold change (FC) of mitochondrial percentage is measured in every cell type between T0 and 12 h, 24 h, and 72 h. FC is indicated by color with white indicating no fold change (FC = 1), blue indicating a drop in mitochondrial percentage, and red indicating an increase in mitochondrial percentage compared to T0 (FC > 1). The Benjamini and Hochberg (BH)-adjusted p values are indicated by asterisk as follows: *p value < 0.01, **_p_ value < 0.00001, and ***_p_ value < 0.00000001. All cells are used including those with high mitochondrial percentage (> 10%), annotated via scmap tool. Gray indicated time points with fewer than 5 cells. Missing values (no sample) are shown by a cross. b Percentage of variance in gene expression explained by time for cell type groups in the lung, esophagus, and spleen. Cell type groups in the lung are Endothelial (Blood vessel, Lymph vessel), Alveolar (Alveolar Type 1 and Type 2), Mono_macro (Monocyte, Macrophage_MARCOneg, Macrophage_MARCOpos), and T_cell (T_CD4, T_CD8_Cyt, T_regulatory). Cell type groups in the spleen are Mono_macro (Monocyte, Macrophage), NK (NK_FCGR3Apos, NK_CD160pos), T_cell (T_CD4_conv, T_CD4_fh, T_CD4_naive, T_CD4_reg, T_CD8_activated, T_CD8_CTL, T_CD8_gd, T_CD8_MAIT-like, T_cell_dividing), and B_cell (B_follicular, B_Hypermutation, B_mantle). c Hierarchical clustering of cell types of up to 10 cells per cell type per tissue per donor and time. Cell attributes (cell type, organ, time, and donor ID) are indicated by color
Similar articles
- FIRM: Flexible integration of single-cell RNA-sequencing data for large-scale multi-tissue cell atlas datasets.
Ming J, Lin Z, Zhao J, Wan X; Tabula Microcebus Consortium; Yang C, Wu AR. Ming J, et al. Brief Bioinform. 2022 Sep 20;23(5):bbac167. doi: 10.1093/bib/bbac167. Brief Bioinform. 2022. PMID: 35561293 Free PMC article. - Optimization of long-term cold storage of rat precision-cut lung slices with a tissue preservation solution.
Tigges J, Eggerbauer F, Worek F, Thiermann H, Rauen U, Wille T. Tigges J, et al. Am J Physiol Lung Cell Mol Physiol. 2021 Dec 1;321(6):L1023-L1035. doi: 10.1152/ajplung.00076.2021. Epub 2021 Oct 13. Am J Physiol Lung Cell Mol Physiol. 2021. PMID: 34643087 - Biobanking of Fresh-Frozen Cancer Tissue: RNA Is Stable Independent of Tissue Type with Less Than 1 Hour of Cold Ischemia.
Song SY, Jun J, Park M, Park SK, Choi W, Park K, Jang KT, Lee M. Song SY, et al. Biopreserv Biobank. 2018 Feb;16(1):28-35. doi: 10.1089/bio.2017.0062. Epub 2017 Nov 17. Biopreserv Biobank. 2018. PMID: 29148824 - Looking at the developing lung in single-cell resolution.
Mižíková I, Thébaud B. Mižíková I, et al. Am J Physiol Lung Cell Mol Physiol. 2021 May 1;320(5):L680-L687. doi: 10.1152/ajplung.00385.2020. Epub 2020 Nov 18. Am J Physiol Lung Cell Mol Physiol. 2021. PMID: 33205990 Review. - Tools for the analysis of high-dimensional single-cell RNA sequencing data.
Wu Y, Zhang K. Wu Y, et al. Nat Rev Nephrol. 2020 Jul;16(7):408-421. doi: 10.1038/s41581-020-0262-0. Epub 2020 Mar 27. Nat Rev Nephrol. 2020. PMID: 32221477 Review.
Cited by
- SARS-CoV-2 infection dynamics in lungs of African green monkeys.
Speranza E, Williamson BN, Feldmann F, Sturdevant GL, Pérez-Pérez L, Mead-White K, Smith BJ, Lovaglio J, Martens C, Munster VJ, Okumura A, Shaia C, Feldmann H, Best SM, de Wit E. Speranza E, et al. bioRxiv [Preprint]. 2020 Aug 20:2020.08.20.258087. doi: 10.1101/2020.08.20.258087. bioRxiv. 2020. PMID: 32839775 Free PMC article. Updated. Preprint. - Abdominal aortic aneurysm and cardiometabolic traits share strong genetic susceptibility to lipid metabolism and inflammation.
Zheng S, Tsao PS, Pan C. Zheng S, et al. Nat Commun. 2024 Jul 5;15(1):5652. doi: 10.1038/s41467-024-49921-7. Nat Commun. 2024. PMID: 38969659 Free PMC article. - Fibroblast-expressed LRRC15 is a receptor for SARS-CoV-2 spike and controls antiviral and antifibrotic transcriptional programs.
Loo L, Waller MA, Moreno CL, Cole AJ, Stella AO, Pop OT, Jochum AK, Ali OH, Denes CE, Hamoudi Z, Chung F, Aggarwal A, Low JKK, Patel K, Siddiquee R, Kang T, Mathivanan S, Mackay JP, Jochum W, Flatz L, Hesselson D, Turville S, Neely GG. Loo L, et al. PLoS Biol. 2023 Feb 9;21(2):e3001967. doi: 10.1371/journal.pbio.3001967. eCollection 2023 Feb. PLoS Biol. 2023. PMID: 36757924 Free PMC article. - Pan-cancer classification of single cells in the tumour microenvironment.
Nofech-Mozes I, Soave D, Awadalla P, Abelson S. Nofech-Mozes I, et al. Nat Commun. 2023 Mar 23;14(1):1615. doi: 10.1038/s41467-023-37353-8. Nat Commun. 2023. PMID: 36959212 Free PMC article. - ACE2 and COVID-19 Susceptibility and Severity.
Zheng M. Zheng M. Aging Dis. 2022 Apr 1;13(2):360-372. doi: 10.14336/AD.2021.0805. eCollection 2022 Apr. Aging Dis. 2022. PMID: 35371596 Free PMC article.
References
Publication types
MeSH terms
LinkOut - more resources
Full Text Sources
Other Literature Sources
Miscellaneous


