Prevention of tuberculosis in macaques after intravenous BCG immunization - PubMed (original) (raw)
. 2020 Jan;577(7788):95-102.
doi: 10.1038/s41586-019-1817-8. Epub 2020 Jan 1.
Joseph J Zeppa 2, Pauline Maiello 2, Joshua A Hackney 1, Marc H Wadsworth 2nd 3 4 5, Travis K Hughes 3 4 5, Supriya Pokkali 1, Phillip A Swanson 2nd 1, Nicole L Grant 6, Mark A Rodgers 2, Megha Kamath 1, Chelsea M Causgrove 2, Dominick J Laddy 7, Aurelio Bonavia 7, Danilo Casimiro 7, Philana Ling Lin 8, Edwin Klein 9, Alexander G White 2, Charles A Scanga 2, Alex K Shalek 3 4 5 10, Mario Roederer # 1, JoAnne L Flynn # 2, Robert A Seder # 11
Affiliations
- PMID: 31894150
- PMCID: PMC7015856
- DOI: 10.1038/s41586-019-1817-8
Prevention of tuberculosis in macaques after intravenous BCG immunization
Patricia A Darrah et al. Nature. 2020 Jan.
Abstract
Mycobacterium tuberculosis (Mtb) is the leading cause of death from infection worldwide1. The only available vaccine, BCG (Bacillus Calmette-Guérin), is given intradermally and has variable efficacy against pulmonary tuberculosis, the major cause of mortality and disease transmission1,2. Here we show that intravenous administration of BCG profoundly alters the protective outcome of Mtb challenge in non-human primates (Macaca mulatta). Compared with intradermal or aerosol delivery, intravenous immunization induced substantially more antigen-responsive CD4 and CD8 T cell responses in blood, spleen, bronchoalveolar lavage and lung lymph nodes. Moreover, intravenous immunization induced a high frequency of antigen-responsive T cells across all lung parenchymal tissues. Six months after BCG vaccination, macaques were challenged with virulent Mtb. Notably, nine out of ten macaques that received intravenous BCG vaccination were highly protected, with six macaques showing no detectable levels of infection, as determined by positron emission tomography-computed tomography imaging, mycobacterial growth, pathology and granuloma formation. The finding that intravenous BCG prevents or substantially limits Mtb infection in highly susceptible rhesus macaques has important implications for vaccine delivery and clinical development, and provides a model for defining immune correlates and mechanisms of vaccine-elicited protection against tuberculosis.
Conflict of interest statement
Authors from University of Pittsburgh, NIH and MIT have no competing interests. A.B. is currently an employee of Vir Biotechnology, Inc., which is developing a CMV-based vaccine candidate for TB.
Figures
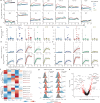
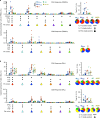
Fig. 1. Cellular composition and immune analysis in blood and BAL after BCG vaccination.
a, Number of cells (geometric mean) per BAL collection for leukocyte populations in each vaccine group before (pre, P) and up to 24 weeks after BCG; Supplementary Data 2 shows individual NHPs and statistical comparisons. Data are from cohorts 1–4 (n = 11–13 macaques per group as outlined in Extended Data Fig. 1) except at weeks 2, 20 and 24 (cohort 4 only, n = 3). Vγ9+/−, Vγ9+/− γδ T cells; MAIT, mucosal-associated invariant T cells; mDC, myeloid dendritic cells; NK, natural killer cells; iNKT, invariant natural killer cells; pDC, plasmacytoid dendritic cells. b, c, Percentage of memory CD4 (b) or CD8 (c) T cells in PBMCs producing IFNγ, IL-2, TNF or IL-17 after PPD stimulation in vitro. Shown are individual and median (horizontal bar) responses for NHPs in challenge study (cohorts 1–3, n = 8–10 macaques) at weeks 4 (peak) and 24 (time of challenge) after BCG vaccination. d, e, Percentage (top) and number (bottom) of cytokine+ memory CD4 (d) and CD8 (e) T cells in the BAL before and up to 16 weeks after BCG vaccination. Shown are individual (grey lines) and mean (coloured lines) responses for challenge cohorts (n = 8–10 macaques). Each group was compared to IDlow at weeks 4 and 24 for PBMCs (one-way ANOVA; P values are Dunnett’s multiple comparison test) or weeks 8 and 16 for BAL (Kruskal–Wallis test; P values are Dunn’s multiple comparison test). f–h, Single-cell transcriptional analysis of BAL cells at weeks 13 and 25 after BCG vaccination (cohort 4; n = 3 per group). f, _Z_-scored heat maps of the average cellular score for modules identified in week 13 PPD-stimulated T cells at weeks 13 and 25 after BCG vaccination. Red P values indicate modules uniquely elevated in the IV BCG group (one-way ANOVA). g, Distributions of module 2 expression in unstimulated and stimulated T cells at weeks 13 and 25 for each group. Percentage module 2-positive is shown; positivity (dashed line) defined as 2 s.d. above the mean score of the unvaccinated (Naive) NHPs. h, Volcano plot showing differentially expressed genes between T cells positive and negative for module 2 at week 13 (P values calculated using the likelihood ratio test with Bonferroni correction). Source Data
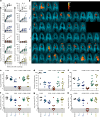
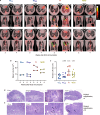
Fig. 2. Protection against Mtb infection after IV BCG immunization.
a, Lung inflammation (total FDG activity) and number of lung granulomas over the course of infection as measured by serial PET–CT scans. Each line shows one NHP over time; 3 NHPs (2 unvaccinated (unvax) and 1 IDlow) reached a humane end point before 12 weeks. tntc, too numerous to count. b, Three-dimensional volume renderings of PET–CT scans of each NHP at the time of necropsy. PET was limited to the thoracic cavity; the standardized uptake value colour bar is shown in the top right and indicates FDG retention, a surrogate for inflammation. c–h, Total lung FDG activity (c), number of lung granulomas (d), gross pathology score (e), total thoracic CFUs (mycobacterial burden) (f), total lung CFUs (g) and total thoracic LN CFUs (h) at time of necropsy. Dashed line in e is assumed normal pathology score accounting for variability in LN size in healthy rhesus macaques. c–h, Symbols represent individual challenged macaques (cohorts 1–3, n = 8–10 vaccinated NHPs; n = 4 unvaccinated NHPs) and horizontal bars represent the median; all data points within the grey areas are zero. Kruskal–Wallis tests were used and reported P values represent Dunn’s multiple comparison test comparing each group to the IDlow group. Source Data
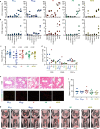
Fig. 3. BCG CFUs and immune responses in tissues one month after BCG immunization.
NHPs (cohorts 5a–c: IDlow, IDhigh and IV, n = 4 NHPs; AE and AE/ID, n = 2 NHPs) were euthanized one month after vaccination to quantify BCG and T cell responses in tissues. a, BCG CFUs at vaccination site(s) (skin, ID only) and in various tissues (per ml blood or bone marrow; per whole spleen, LN or lung lobe; or per total BAL collected). L, left; R, right; ND, not determined. b, c, Frequency of memory CD4 (b) and CD8 (c) T cells producing IFNγ, IL-2, TNF or IL-17 after PPD stimulation. Matched symbols within each vaccine group are the same macaque. Kruskal–Wallis tests were run and reported P values represent Dunn’s multiple comparison test comparing each group to the IDlow group. d, Total viable cells per gram of lung tissue for each vaccine regimen; data are shown as the median of four macaques per group (solid symbols, six lung lobes from each NHP are averaged) or as counts for each lung lobe (n = 24 lobes) from all NHPs (open symbols with lobes from same macaque matched). Kruskal–Wallis test was run on medians; Dunn’s adjusted P values are from comparing each group to the IDlow group. e, Quantification of CD3+, CD20+ and CD11c+ cells from two lung sections per NHP (matched symbols, n = 2 macaques). f, Representative (one out of four) 1 mm2 lung sections from each BCG regimen stained with haematoxylin and eosin (H&E; top) or with antibodies against CD3+ T cells (red), CD20+ B cells (green), and CD11c+ macrophages or dendritic cells (blue). Source Data
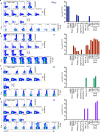
Fig. 4. Detection of T cells in lung tissue after IV BCG immunization.
a, One month after BCG vaccination, tissue-derived versus blood-derived cells in lung were delineated by injecting NHPs with a fluorochrome-conjugated anti-CD45 antibody (ivCD45) to label leukocytes in the vasculature. NHPs (cohort 6, n = 2 macaques) received 5 × 10⁷ CFUs BCG ID, IV, AE or endobronchially (EB) into the left lung. At necropsy, BCG CFUs were quantified in tissues and cells were stained immediately ex vivo for surface marker expression (a) or stimulated with Mtb whole-cell lysate (WCL) and stained for cytokine production (b, c). Plots show CD4 T cells from the BAL and lung lobes (RU, right upper; RM, right middle; RL, right lower; LU, left upper; LL, left lower) from one of two macaques per BCG regimen. a, Percentage of ivCD45− (unstimulated) CD4 T cells expressing the tissue-resident/activation marker CD69; BCG CFUs (if detected) are indicated by red bars and right scale. b, Percentage of WCL-responsive (IFNγ+) CD4 T cells in BAL and lung tissue (ivCD45−) and (c) the percentage of IFNγ+ CD4 memory T cells expressing CD69 and CD103 after IV BCG vaccination. Source Data
Extended Data Fig. 1. Study design, vaccine regimens, macaques and cohorts.
a, Vaccine groups including route of BCG administration, target dose of BCG to be delivered (CFUs), and number of NHPs per BCG regimen (n = 10 macaques except IDhigh, n = 8 macaques). Note that IDlow and IDhigh groups received BCG in one or two sites, respectively, and AE/ID group received AE (high-dose) and ID (low-dose) BCG simultaneously. Unvaccinated macaques (n = 4) were used as Mtb challenge controls. b, Timeline for Mtb challenge cohorts including weeks relative to BCG vaccination for PBMC and BAL sample collection, Mtb challenge, PET–CT scanning, and scheduled necropsy after challenge. Macaques that met humane end-point criteria were euthanized earlier than 12 weeks post-challenge (Supplementary Table 1). c, Data are from a total of 115 rhesus macaques, 52 of which were challenged with Mtb. Owing to the ABSL-3 capacity constraints and logistical limits in the number of macaques that can be sampled, scanned by PET–CT, or necropsied at any given time point, studies were broken into sequentially immunized and/or challenged cohorts. A maximum of 20 NHPs were infected with Mtb in any challenge cohort with infections split over 2 days, staggered by 2 weeks. The actual doses of BCG administered, determined by subsequent culture, is noted for each vaccine group. The time interval between vaccination and challenge is noted in weeks and the challenge dose of Mtb (CFUs) is listed for each challenge cohort (BCG vaccine dose and Mtb challenge dose for individual NHPs, along with peak immune responses and detailed outcome data, is provided in Supplementary Table 1). Protection data are from 8–10 BCG-immunized NHPs per group and 4 unvaccinated controls in cohorts 1–3 (‘Immunology & challenge’). Per protocol, BAL samples were not collected from animals 8 weeks before, or after, Mtb challenge. Three NHPs per vaccine group were immunized just as in cohorts 1–3 but were not challenged. Instead, these macaques (cohort 4; ‘Immunology only’) were sampled (BAL, PBMC) for 6 months after BCG immunization and then euthanized to perform extensive immune analysis in various tissues at what would have been the time of challenge. BAL samples from cohort 4 were transcriptionally profiled at weeks 13 and 25. Cohort 5 (a–c) includes 4 macaques per group (except AE and AE/ID groups, n = 2 NHPs each) that were immunized with BCG and were euthanized 1–3 months later to assess BCG CFUs and T cell responses in various tissues. NHPs in cohort 6 (‘ivCD45’, n = 2 macaques per group) received anti-CD45 injection before necropsy to distinguish blood- and tissue-derived cells. Pilot cohorts (a–c) include NHPs enrolled in the dose-finding pilot study (n = 3 macaques per dose and route; ‘Immunology pilot’).
Extended Data Fig. 2. Clinical parameters after BCG vaccination in NHPs.
To assess safety of BCG vaccinations, all macaques (cohorts 1–4 excluding unvaccinated) were monitored for changes in several clinical parameters at various time points after BCG. After vaccination, changes were observed predominantly in IV BCG macaques; however, all were transient. a, Weight and temperature: there was a 0.9 °C increase in body temperature in the IV BCG group at day 1, which resolved by day 2; the average pre-vaccination temperature across all NHPs was 38.4 °C. b, Liver function tests (alanine aminotransferase (ALT), aspartate aminotransferase (AST), albumin and globulin): there was a twofold increase in ALT and AST above pre-vaccination levels (20–30 IU l−1) in the IV BCG group, which resolved by day 28. c, C-reactive protein (CRP) in the IV BCG group increased up to a median of 400 μg ml−1 at day 2, which resolved by day 14; the average pre-vaccination CRP level in plasma across all NHPs ranged from 0 to 28 μg ml−1. d, Complete blood counts (CBC). Transient increases in numbers of circulating neutrophils (day 1) and lymphocytes, monocytes and basophils (day 7) were observed in the IV BCG group. All tests were performed longitudinally on whole blood at time of collection except CRP, which was batch-analysed from frozen plasma samples; the 6-h time point was measured for CRP only. Data points shown are individual NHPs (n = 11–13 per group, n = 63 total) with interquartile range (box) and median (line). For each parameter, pre-vaccination (P) measurements for all NHPs were combined and compared against distributions from every vaccine group at every time point using Dunnett’s test for multiple comparisons; *P < 0.05. No clinical signals, such as lethargy, appetite suppression or weight loss, were observed up to time of Mtb challenge, 24 weeks later. Source Data
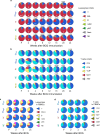
Extended Data Fig. 3. Proportions of leukocyte and T cell subsets in the BAL and PBMCs after BCG immunization.
a–d, We assessed whether the composition of leukocytes in the BAL or PBMCs was altered after BCG vaccination. Shown are pie graphs comprising proportions of indicated leukocytes (a, c) or CD3+ T cell subsets (b, d) in BAL (a, b) and PBMCs (c, d) for each BCG regimen from pre-vaccination up to 24 weeks post-BCG, identified using multi-parameter flow cytometry as in Supplementary Data 8. a, In the BAL, the rapid and sustained increase in T cell (but not macrophage) number (Fig. 1a and Supplementary Data 2b) altered the overall cellular composition of BAL from approximately 75% alveolar macrophages (red) and 15% T cells (blue) before vaccination to approximately 65% T cells and 30% macrophages, even 6 months after IV BCG. b, To delineate the composition of BAL T cells further, the proportions of CD4 and CD8 T cells, as well as non-classical T cells (γδ, MAIT and iNKT) that may also have a role in protection against TB– were assessed. Two weeks after vaccination, there was a substantial but transient increase in the proportion of Vγ9+ γδ T cells and MAIT cells after IV BCG, and a trend towards increased Vγ9+ γδ T cells and MAIT cells after BCG IDhigh. However, by 8 weeks, the proportions of these non-classical T cells contracted to pre-vaccination levels. c, d, A similar analysis was performed to determine how the route of BCG immunization influenced the composition of leukocytes in PBMCs. Here, IV BCG induced a transient increase in Vγ9+ γδ T cells but not MAIT cells. BAL pie graphs represent the average proportions from 13 NHPs per BCG regimen (cohorts 1–4; Extended Data Fig. 1c) except where indicated (white numbers in a also apply to b). PBMC pie graphs represent the average proportions from three NHPs per BCG regimen (cohort 4). B, B cells; Mφ, macrophages; Mono, monocytes; T, T cells; Neut, neutrophils. P values indicate differences compared to pre-vaccination within the same vaccine group using a Permutation test. Source Data
Extended Data Fig. 4. Extended immune data from challenge and immunology cohorts.
a, b, Full kinetics of PBMC responses from NHPs in challenge cohorts (cohorts 1–3, n = 8–11 macaques) as in Fig. 1b, c. Shown is the frequency of memory CD4 (a) or CD8 (b) T cells producing any combination of IFNγ, IL-2, TNF or IL-17 in response to PPD stimulation at various time points before and up to 24 weeks after BCG. Grey lines are individual NHP responses; bold, coloured lines represent the median response. Each group was compared to IDlow at weeks 4 and 24 (one-way ANOVA; P values are Dunnett’s multiple comparison test). c, d, T cell responses from a replicate cohort of similarly BCG-immunized rhesus macaques (cohort 4, n = 3 NHPs) from which BAL was collected for 24 weeks after BCG vaccination. Shown is the frequency (top) or absolute number (log10-transformed; bottom) of CD4 (c) or CD8 (d) memory T cells expressing any combination of IFNγ, IL-2, TNF or IL-17 in response to PPD stimulation, before and up to 24 weeks after BCG vaccination. Kruskal–Wallis test was used to compare each group to IDlow at weeks 8 (peak) and 24 (time of challenge); P values are Dunn’s multiple comparison test. e, f, The memory phenotype of antigen-responsive CD4 (e) and CD8 (f) T cells in PBMCs and BAL at the peak of the response (week 4 for PBMC, week 8–12 for BAL; cohorts 1–3, n = 8–10 macaques) and time of challenge (week 24 collected for PBMC only) was assessed. Cytokine-positive T cells from PBMCs were categorized as central memory (TCM), TTM, effector memory (TEM), or terminal effectors (TEF) based on expression of CD45RA, CD28 and CCR7 as shown in Supplementary Data 10. Most responding cells in PBMCs were central memory and transitional memory T cells, with the proportion of transitional memory cells greater in IDhigh- and IV-BCG-immunized NHPs compared with the IDlow group. In BAL, where T cells are CCR7-negative, most responding CD4 T cells were CD45RA−CD28+ TTM cells (Supplementary Data 9). For CD8 memory phenotypes, pie graphs are shown only for groups that displayed measurable frequencies of cytokine+ CD8 T cells. IV-BCG-immunized NHPs had larger proportions of TEM cells in PBMCs and BAL, which suggests a more diverse composition of memory and effector cells than other routes. P values indicate differences compared to IDlow using a permutation test (CD4 pie graphs only). g–j, PBMC T cell responses from a replicate cohort of similarly BCG-immunized rhesus macaques (cohort 4, n = 3 macaques). Shown is the frequency of CD4 (g) and CD8 (h) memory T cells producing any combination of IFNγ, IL-2, TNF or IL-17 in response to PPD stimulation before and up to 24 weeks after BCG. i, j, As an immunological indicator of recent antigen exposure and proliferation due to BCG persistence in vivo, Ki-67 expression in PBMCs over the course of immunization was assessed. Shown is the percentage of cytokine-positive (closed symbols, solid lines) or cytokine-negative (open symbols, dashed lines) memory CD4 or CD8 T cells expressing Ki-67 as identified in Supplementary Data 11. In IV-BCG-immunized NHPs, at least 60% of antigen-responsive CD4 T cells in blood were Ki-67+ at 2 and 4 weeks after BCG but were at baseline 6 months later. Source Data
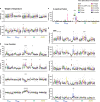
Extended Data Fig. 5. Quality of T cell responses in PBMCs and BAL after BCG immunization.
The composition of the cytokine responses at the single-cell level, or ‘quality’ of the response, can reveal distinct functional differences that associate with protection against Mtb and other pathogens,. Here, the quality was defined by the relative proportion of antigen-stimulated cells producing every combination of IFNγ, IL-2 and TNF, with or without CD154 or IL-17. CD154 (also known as CD40L) expression in PBMCs was measured as a sensitive marker for detection of all antigen-stimulated CD4 T cells based on evidence for CD4-dependent, IFNγ-independent mechanisms of protection against TB,. Shown are peak PPD-responsive memory CD4 and CD8 T cell responses in PBMCs (a, week 4) or BAL (b, week 12) after BCG vaccination for challenge cohorts 1–3 (n = 8–11 NHPs); analysis of all time points is shown in Supplementary Data 4 and 5. a, Bar graphs show the frequency of T cells in PBMCs expressing CD154 with IFNγ, IL-2, or TNF production, and total IL-17 production (CD4 response, top) or IFNγ, IL-2, or TNF for the CD8 response (bottom). Individual NHP responses are shown with interquartile range (bar) and median (horizontal line). Pie graphs represent the proportion of the total response comprising each cytokine combination, averaged for all NHPs, and are not shown for groups with low to undetectable responses. The proportion of the response producing IL-17 (with or without other cytokines) is indicated with a black arc and the proportion expressing CD154 alone is the black pie section. b, Bar graphs show the frequency of CD4 or CD8 T cells in BAL producing IFNγ, IL-2 or TNF, and total IL-17 production. Pie graphs represent the average proportion of total cytokine production comprising each cytokine combination; the proportion of the total response producing IL-17 (with or without other cytokines) is indicated with a black arc. Despite the notable differences in the magnitude of responses amongst BCG regimens, there were no differences in the quality of CD4 T cell responses nor CD8 T cell responses in PBMC or BAL. Of note, approximately 90% of the CD4 T cell responses were composed of TH1 cytokines with fewer than 10% also producing IL-17; most IL-17 producing CD4 T cells co-expressed TH1 cytokines. Source Data
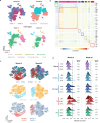
Extended Data Fig. 6. Identification of gene modules and distribution of module scores.
A total of 162,490 single-cell transcriptomes derived from unstimulated and PPD-stimulated BAL cells from 15 NHPs (cohort 4, n = 3 per group) at weeks 13 (peak of BAL response) and 25 (time of challenge) were profiled. a, Uniform manifold approximation and projection (UMAP) plots of BAL cells at weeks 13 and 25 after BCG immunization, coloured by time point (top left), PPD stimulation condition (top right), and cell type (week 13, bottom left; week 25, bottom right). b, Gene–gene correlation heat map showing significant gene modules (M1–M7; top) identified among week 13 stimulated BAL T cells with select genes (right) highlighted. c, _t_-Distributed stochastic neighbour embedding (_t_-SNE) plots of stimulated BAL T cells from weeks 13 (left) and 25 (right), coloured by vaccine group (top), T cell subtypes (middle), and module 2-positivity (bottom). d, Histograms of the distribution of module 2 scores by vaccine group (colour) and macaque. Dashed line (placed at two s.d. above the mean score in the naive controls) indicates the threshold used to call cells as positive for the module. The percentage module 2-positive is shown for each NHP. Source Data
Extended Data Fig. 7. Humoral immune response in BAL and plasma after BCG immunization.
Mtb-responsive antibody responses were assessed in BAL and plasma after BCG immunization. Mtb WCL-specific IgG, IgA and IgM antibody titres were measured from individual NHPs at various time points before and after BCG immunization. Shown are end-point titres for IgG and IgA and mid-point titres for IgM (in which the end point was not reached) a, Antibody titres in tenfold-concentrated BAL fluid (cohorts 1–4, n = 11–13 macaques except at weeks 2, 20 and 24, cohort 4 only, n = 3 macaques). In concentrated BAL fluid, antigen-responsive IgG, IgA and IgM were detected only in IV-BCG-immunized NHPs and returned to pre-vaccination levels by the time of challenge. b, Antibody titres in plasma (n = 11–13 macaques). In plasma, both IDhigh and IV BCG elicited increased IgG and IgA antibody responses compared to IDlow BCG. Data are geometric mean and s.d.; dashed line indicates assay limit of detection. A Kruskal–Wallis test was used to compare all vaccine groups to IDlow at weeks 4, 16 and 24 (BAL) or weeks 4 and 24 (plasma); P values are from Dunn’s multiple comparison test (colour-coded to vaccine). Source Data
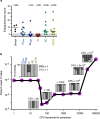
Extended Data Fig. 8. IV BCG protects against extrapulmonary disease and lung infection across a wide range of thresholds of protection.
a, Extrapulmonary disease was scored at necropsy based on a published system taking into account the presence of Mtb-related pathology and Mtb growth from sites outside the thoracic cavity. Each symbol represents an animal and horizontal bars represent the median. Kruskal–Wallis tests were used and reported P values represent Dunn’s multiple comparison test comparing each group to IDlow. All data points within the grey areas are zero. There was no extrapulmonary disease in any of the IV-BCG-vaccinated macaques, whereas the other groups had variable extrapulmonary involvement. b, Fisher’s exact test P values are plotted for a range of CFU thresholds evaluating protection. For each threshold, a stacked bar plot indicates the percentage of NHPs with fewer CFUs than the threshold (that is, protected), in each vaccine group. Immunization route significantly (P < 10−4) impacted protection at any given CFU threshold between <1 (sterile) and <104. Source Data
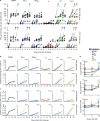
Extended Data Fig. 9. Post-challenge immune responses to mycobacterial antigens.
a, PBMC response to ESAT-6 or CFP-10 peptides (antigens present in Mtb but not BCG) as determined by IFNγ ELISpot throughout Mtb infection. Each line is one NHP over time (n = 8–10 macaques; n = 4 unvaccinated); sterile animals are represented by a triangle, and non-sterile, protected animals (with 1 ≤ CFUs ≤ 50) denoted by squares. After infection, most animals in the AE or ID vaccine groups developed ESAT-6 or CFP10 ELISpot responses, which reflects a primary response to Mtb. By contrast, responses in the IV BCG group were lower than in the IDlow group at every time point after infection for ESAT-6 (4 weeks, P = 0.001; 6 weeks, P = 0.045; 8 weeks, P = 0.025; 12 weeks, P = 0.006) and CFP-10 (4 weeks, P < 0.0001; 6 weeks, P = 0.035; 8 weeks, P = 0.001; 12 weeks, P = 0.004). Kruskal–Wallis test was run at each time point with Dunn’s adjusted P values reported accounting for comparisons of all groups against IDlow. b, c, The frequency of memory CD4 (b) and CD8 (c) T cells in PBMCs from BCG-immunized NHPs (n = 8–10) producing any combination of IFNγ, IL-2, TNF or IL-17 in response to stimulation with either PPD (antigen present in BCG and Mtb; top row) or pooled ESAT-6 and CFP-10 peptides (antigens present in Mtb only; bottom row) were measured at the time of challenge (0), and at 4, 8 and 12 weeks after Mtb challenge. Measurements from four unvaccinated, infected NHPs are included as controls (Unvax, black). Grey lines represent the responses of individual animals and bolded, coloured lines are the mean responses for each vaccine group. d, Antibody responses post-challenge. Mtb WCL-specific IgG, IgA and IgM antibody titres were measured in the plasma of unvaccinated (n = 4) and vaccinated (n = 8–10) NHPs at the time of challenge (0), and at 4 and 12 weeks after challenge. In b–d, Wilcoxon signed-rank unadjusted P values compare cytokine frequencies or antibody titres at week 12 after Mtb (or necropsy) to the time of challenge (week 0) within each vaccine group. Source Data
Extended Data Fig. 10. Inflammation and gross and histopathological assessment after BCG vaccination.
a, Serial FDG PET–CT scans at 2 and 4 weeks after BCG vaccination showed increased metabolism (surrogate for inflammation) localized to the lung LNs (green arrows), lung lobes and spleen (yellow arrow) elicited by the IV but not by other routes (cohort 5a, b, n = 2 macaques). Warm colours indicate increased FDG retention; scale represents standardized uptake values. NHP ID numbers are listed above each scan; ‘H’ denotes the heart. b, Spleen volume was calculated from CT scans at 2 and 4 weeks after BCG vaccination (n = 2 macaques). At these time points, animals given IV BCG had approximately twofold larger spleens than those given ID BCG, with AE/ID BCG NHPs also displaying modestly enlarged spleens. c, Thoracic LNs were measured at necropsy, 4 weeks after BCG vaccination (n = 2 macaques); LNs from IV BCG NHPs were enlarged compared to those from IDlow NHPs. Kruskal–Wallis test was run; Dunn’s adjusted P values are reported comparing each vaccine group to the IDlow group. d, e, H&E-stained sections of thoracic LNs from vaccinated NHPs (n = 2 macaques), 4 weeks after BCG vaccination. d, General structure with respect to cortical and medullary architecture and appearance was normal in LNs from IDlow, IDhigh and AE/ID vaccinated NHPs. The thoracic LNs from the IV-vaccinated macaques demonstrated marked follicular lymphoid hyperplasia, with enlarged, prominent, variably sized follicles, often with active, expanded germinal centres. Original magnification, ×4. e, Small, non-necrotizing epithelioid histiocytic aggregates (non-necrotizing granulomas, black arrows) were abundantly disseminated within thoracic LNs from the IV BCG macaques. In the AE/ID NHPs, a wide nodal distribution of such lesions was also seen, although granuloma numbers and density were substantially less. The IDhigh NHPs had only one observable granuloma in a single thoracic LN and in the IDlow NHPs, no such structures were evident. Original magnification, ×10. Source Data
Extended Data Fig. 11. Immune response to BCG 6 months after vaccination.
Analysis of tissue T cell responses, lung cell counts, immunohistochemistry, splenic volume and PET–CT scans was performed 6 months after BCG vaccination. a–c, A separate cohort (cohort 3, n = 3 macaques) was vaccinated with BCG in parallel to the challenge study with the purpose of assessing immune responses in various tissues 6 months after BCG (the time point at which macaques would be challenged). a, b, Frequency of memory CD4 (a) and CD8 (b) T cells producing any combination of IFNγ, IL-2, TNF, or IL-17 in response to Mtb WCL stimulation in the PBMC, spleen, bone marrow, peripheral LN, lung LN, lung tissue and BAL. Six months after IV BCG, immunized NHPs maintained increased frequencies of antigen-responsive T cells in spleen, BAL and lung lobes. Individual LN and lung lobe responses were averaged per macaque. Data points are individual macaques with symbols matched across tissues within a vaccine group; horizontal bar indicates the mean response. c, Number of cells recovered per gram of lung tissue for each NHP; the increased numbers of total cells observed at 1 month post-BCG (Fig. 3d) were not detected at 6 months post-BCG. Data are shown as the median of 3 macaques per group (solid symbols, counts from six lung lobes per animal are averaged) or as counts for individual lung lobes for each animal (open symbols; lobes from the same animal have matched symbols). Kruskal–Wallis test was used, and P values represent Dunn’s multiple comparison test comparing each vaccine group to the IDlow group. d, Quantification of CD3+, CD20+, CD11c+ cells from two lung sections (matched symbols) from 1–2 macaques per group using Cell Profiler. e, Representative 1-mm2 lung sections from 1–2 macaques per vaccine group were stained with H&E or with antibodies against CD3+ T cells (red), CD20+ B cells (green), and CD11c+ macrophages or dendritic cells (blue). Neither the increase in numbers of T cells and CD11c+ cells nor the histopathological changes in lung sections from IV-BCG-immunized macaques observed at 1 month (Fig. 3e, f) were detected 6 months after BCG vaccination. f, Spleen volume was calculated from CT scans of 44 NHPs (cohorts 1–3) just before Mtb challenge (6 months after BCG vaccination) and was not significantly different among vaccine routes (Kruskal–Wallis test, P = 0.1643). Dots represent individual animals. g, Axial (top) and coronal (bottom) PET–CT scans of two representative macaques (n = 8–10) from each vaccine group 6 months after BCG, before Mtb infection. Animal ID numbers are shown below each set of scans. No detectable lung inflammation (FDG uptake) was observed in macaques from any vaccine group. Source Data
Extended Data Fig. 12. Determination of immune responses and BCG in tissues 1 month after immunization.
NHPs (cohort 6, n = 2) were immunized with 5 × 10⁷ BCG CFUs (IDhigh (a), IV (b), AE (c), or EB (d)); BCG CFUs and antigen-responsive T cells were measured in various tissues 1 month later. Before euthanasia, a fluorochrome-conjugated anti-CD45 antibody was injected intravenously (ivCD45) such that circulating (intravascular) leukocytes were uniformly stained (ivCD45+) while leukocytes in the tissue remained protected from staining (ivCD45−). To investigate whether antigen-responsive (IFNγ+) CD4 T cells were located in the ivCD45− lung tissue compartment, cells isolated from lung lobes were re-stimulated in vitro with Mtb WCL and analysed by intracellular cytokine staining. FACS plots show memory CD4 T cells in all tissues collected from one of two NHPs per BCG regimen, organized by type/location (systemic, peripheral LN, lung LN, BAL and lung lobes). The BAL and lung responses from the IV BCG NHPs, shown in the bottom row of b, is reproduced from Fig. 4b. Pre-infusion PBMC indicates PBMCs isolated from whole blood collected just before anti-CD45 injection. Bar graphs show the number of BCG CFUs in each respective tissue for each animal (colour-coded by vaccine), if detected. Source Data
Extended Data Fig. 13. Relationships between peak T cell responses in BAL or PBMCs and total CFUs at necropsy.
a–d, Linear regressions were used to test whether antigen-responsive CD4 (a, b) or CD8 (c, d) T cell numbers (BAL; a, c) or frequencies (PBMC; b, d) after BCG immunization are associated with disease severity (total CFUs). Results indicate that when controlling for all vaccine routes, peak CD4 T cells in the BAL and PBMC, and peak CD8 T cells in the BAL do not have a significant association with total CFUs (Supplementary Table 5a–c). Of note, in PBMCs, higher peak CD8 frequencies are associated with lower total CFUs after controlling for route (Supplementary Table 5d). Each dot represents an individual animal; coloured lines represent linear fit for each vaccine route. Dotted black lines represent linear fit for all vaccine routes combined (with 95% confidence interval shaded in grey). Source Data
Comment in
- Tuberculosis vaccine finds an improved route.
Behar SM, Sassetti C. Behar SM, et al. Nature. 2020 Jan;577(7788):31-32. doi: 10.1038/d41586-019-03597-y. Nature. 2020. PMID: 31894152 No abstract available. - The trick that could inject new life into an old tuberculosis vaccine.
[No authors listed] [No authors listed] Nature. 2020 Jan;577(7789):145. doi: 10.1038/d41586-020-00003-w. Nature. 2020. PMID: 31911698 No abstract available. - Routemaps for Highly Effective Tuberculosis Vaccination.
Assmann M, Mayer-Barber KD. Assmann M, et al. Immunity. 2020 Feb 18;52(2):219-221. doi: 10.1016/j.immuni.2020.01.017. Immunity. 2020. PMID: 32075726 Free PMC article. - Renewing the Fight Against TB with an Old Vaccine.
Scriba TJ, Mizrahi V. Scriba TJ, et al. Cell. 2020 Mar 5;180(5):829-831. doi: 10.1016/j.cell.2020.02.024. Cell. 2020. PMID: 32142676
Similar articles
- Imprinting of Gut-Homing Receptors on Mtb-Specific Th1* Cells Is Associated with Reduced Lung Homing after Gavage BCG Vaccination of Rhesus Macaques.
Hoft SG, Kauffman KD, Sakai S, Lindestam Arlehamn CS, Sette A, Hoft DF, Herbert R, Barber DL. Hoft SG, et al. mBio. 2023 Apr 25;14(2):e0022023. doi: 10.1128/mbio.00220-23. Epub 2023 Mar 7. mBio. 2023. PMID: 36880755 Free PMC article. - Nanocages engineered from Bacillus Calmette-Guerin facilitate protective Vγ2Vδ2 T cell immunity against Mycobacterium tuberculosis infection.
Pi J, Zhang Z, Yang E, Chen L, Zeng L, Chen Y, Wang R, Huang D, Fan S, Lin W, Shen H, Xu JF, Zeng G, Shen L. Pi J, et al. J Nanobiotechnology. 2022 Jan 15;20(1):36. doi: 10.1186/s12951-021-01234-3. J Nanobiotechnology. 2022. PMID: 35033108 Free PMC article. - Alternative BCG delivery strategies improve protection against Mycobacterium tuberculosis in non-human primates: Protection associated with mycobacterial antigen-specific CD4 effector memory T-cell populations.
Sharpe S, White A, Sarfas C, Sibley L, Gleeson F, McIntyre A, Basaraba R, Clark S, Hall G, Rayner E, Williams A, Marsh PD, Dennis M. Sharpe S, et al. Tuberculosis (Edinb). 2016 Dec;101:174-190. doi: 10.1016/j.tube.2016.09.004. Epub 2016 Oct 8. Tuberculosis (Edinb). 2016. PMID: 27865390 Free PMC article. - [Novel vaccines against M. tuberculosis].
Okada M. Okada M. Kekkaku. 2006 Dec;81(12):745-51. Kekkaku. 2006. PMID: 17240920 Review. Japanese. - Is interferon-gamma the right marker for bacille Calmette-Guérin-induced immune protection? The missing link in our understanding of tuberculosis immunology.
Abebe F. Abebe F. Clin Exp Immunol. 2012 Sep;169(3):213-9. doi: 10.1111/j.1365-2249.2012.04614.x. Clin Exp Immunol. 2012. PMID: 22861360 Free PMC article. Review.
Cited by
- COVID-19 pandemic: SARS-CoV-2 specific vaccines and challenges, protection via BCG trained immunity, and clinical trials.
Gong W, Aspatwar A, Wang S, Parkkila S, Wu X. Gong W, et al. Expert Rev Vaccines. 2021 Jul;20(7):857-880. doi: 10.1080/14760584.2021.1938550. Epub 2021 Jun 15. Expert Rev Vaccines. 2021. PMID: 34078215 Free PMC article. Review. - Outcomes of patients undergoing lung resection for drug-resistant TB and the prognostic significance of pre-operative positron emission tomography/computed tomography (PET/CT) in predicting treatment failure.
Calligaro GL, Singh N, Pennel TC, Steyn R, Brink A, Esmail A, Mottay L, Oelofse S, Mastrapa BL, Basera W, Manning K, Ofoegbu C, Linegar A, Dheda K. Calligaro GL, et al. EClinicalMedicine. 2022 Nov 3;55:101728. doi: 10.1016/j.eclinm.2022.101728. eCollection 2023 Jan. EClinicalMedicine. 2022. PMID: 36386040 Free PMC article. - Pneumonia caused by Mycobacterium tuberculosis.
Wei M, Yongjie Zhao, Zhuoyu Qian, Biao Yang, Xi J, Wei J, Tang B. Wei M, et al. Microbes Infect. 2020 Jul-Aug;22(6-7):278-284. doi: 10.1016/j.micinf.2020.05.020. Epub 2020 Jun 16. Microbes Infect. 2020. PMID: 32561408 Free PMC article. - Vaccine development against tuberculosis before and after Covid-19.
Kaufmann SHE. Kaufmann SHE. Front Immunol. 2023 Nov 15;14:1273938. doi: 10.3389/fimmu.2023.1273938. eCollection 2023. Front Immunol. 2023. PMID: 38035095 Free PMC article. Review. - Leveraging the modularity of biomaterial carriers to tune immune responses.
Tsai SJ, Black SK, Jewell CM. Tsai SJ, et al. Adv Funct Mater. 2020 Nov 25;30(48):2004119. doi: 10.1002/adfm.202004119. Epub 2020 Sep 11. Adv Funct Mater. 2020. PMID: 33692662 Free PMC article.
References
- World Health Organization. Global Tuberculosis Reporthttps://www.who.int/tb/publications/global_report/en/ (2018).
- Mangtani, P. et al. Protection by BCG vaccine against tuberculosis: a systematic review of randomized controlled trials. Nephrol. Dial. Transplant. 58, 470–480 (2014). - PubMed
Publication types
MeSH terms
Substances
LinkOut - more resources
Full Text Sources
Other Literature Sources
Medical
Molecular Biology Databases
Research Materials
