Single-cell RNA sequencing of human kidney - PubMed (original) (raw)
doi: 10.1038/s41597-019-0351-8.
Jinling Liao # 1 2 3, Zhenyuan Yu # 1 2 3 4 5, Yang Chen # 1 2 3 4 5, Mengying Bao 1 2 3, Haiying Zhang 1 2 3, Deyun Liu 4 5, Tianyu Li 4 5, Qingyun Zhang 1 2 3 4 8, Jiaping Li 9 10 11, Jiwen Cheng 12 13 14 15 16, Zengnan Mo 17 18 19 20 21
Affiliations
- PMID: 31896769
- PMCID: PMC6940381
- DOI: 10.1038/s41597-019-0351-8
Single-cell RNA sequencing of human kidney
Jinling Liao et al. Sci Data. 2020.
Abstract
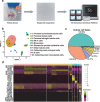
A comprehensive cellular anatomy of normal human kidney is crucial to address the cellular origins of renal disease and renal cancer. Some kidney diseases may be cell type-specific, especially renal tubular cells. To investigate the classification and transcriptomic information of the human kidney, we rapidly obtained a single-cell suspension of the kidney and conducted single-cell RNA sequencing (scRNA-seq). Here, we present the scRNA-seq data of 23,366 high-quality cells from the kidneys of three human donors. In this dataset, we show 10 clusters of normal human renal cells. Due to the high quality of single-cell transcriptomic information, proximal tubule (PT) cells were classified into three subtypes and collecting ducts cells into two subtypes. Collectively, our data provide a reliable reference for studies on renal cell biology and kidney disease.
Conflict of interest statement
The authors declare no competing interests.
Figures
Fig. 1
scRNA-seq reveals the cell populations of the human kidney. (a) Overview of the scRNA-seq process using human kidney tissue samples. (b) Uniform manifold approximation and projection (UMAP) plot showing the unbiased classification of renal cells. (c) Pie chart showed the proportion of each kidney cell type. (d) Heat map showing the marker genes of each cluster, highlighting the selected marker genes for each cluster.
Fig. 2
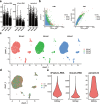
Quality control (QC) of human kidney single cell data. (a) Scatterplot illustrating the number of genes, unique molecular identifiers (UMIs) and the percentage of mitochondrial genes in each cell of three kidney samples. (b) The relationship between the percentage of mitochondrial genes and the mRNA reads, together with the relationship between the amount of mRNA and the reads of mRNA. (c) We detected the batch effect between three different kidney samples. (d) UMAP plot showing the cell cycle status of each cell. (e) Violin plot illustrating the number of genes, unique molecular identifiers (UMIs) and the percentage of mitochondrial genes in previous kidney single-cell data from GSE107585.
Fig. 3
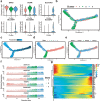
Subpopulations of PT cells and reconstructing the developmental trajectory of PT cells. (a) Violin plots representing the expression of marker genes in PT cells. Clusters 1, 2 and 3 refer to the proximal convoluted tubule, proximal tubule and proximal straight tubule, respectively. (b) Monocle2-generated pseudotemporal trajectory of three PT cell types (n = 20,308); imported Seurat data are coloured according to the cell name designation. (c) Pseudotime was coloured in a gradient from dark to light blue, and the start of pseudotime is dark. (d) The pseudotime trajectory was divided into three different states by Monocle2. (e) The trajectory showing the distribution of cells from three samples. (f) The top six genes influencing fate decisions are shown as line plots displayed as the expression level over pseudotime by Monocle2. (g) Heat map for clustering the top 50 genes that affected cell fate decisions. These 50 genes were divided into three clusters (cluster 1, cluster 2 and cluster 3), showing genes at the beginning stage, the transitory stage and the end stage of the developmental trajectory, respectively.
Fig. 4
Detailed classification of collecting duct cells and NK-T cells by scRNA-seq. (a) Violin plot showing the expression of the collecting duct principal cell marker AQP2 and the collecting duct intercalated cell markers ATP6V1B1, ATP6V0D2 and ATP6V1G3. Clusters 8 and 10 are collecting duct principal cells and collecting duct intercalated cells, respectively. (b) UMAP plot showing the spatial location of NKT cells and T cells after dimensionality reduction. The red dots represent NKT cells and the green dots represent T cells. (c–g) Violin plots showing the expression of the NK cells markers GNLY and NKG7. Violin plots showing the expression of the T cell markers CD3D, CD3E and IL7R.
Similar articles
- Sex-specific proximal tubular cell differentiation pathways identified by single-nucleus RNA sequencing.
Lu YA, Smith T, Deshpande S, Liao CT, Talabani B, Grigorieva I, Mason A, Andrews R, Bowen T, Taylor PR, Fraser D. Lu YA, et al. Sci Rep. 2024 Oct 14;14(1):24041. doi: 10.1038/s41598-024-73102-7. Sci Rep. 2024. PMID: 39402239 Free PMC article. - Role of HRTPT in kidney proximal epithelial cell regeneration: Integrative differential expression and pathway analyses using microarray and scRNA-seq.
Shrestha S, Singhal S, Kalonick M, Guyer R, Volkert A, Somji S, Garrett SH, Sens DA, Singhal SK. Shrestha S, et al. J Cell Mol Med. 2021 Nov;25(22):10466-10479. doi: 10.1111/jcmm.16976. Epub 2021 Oct 9. J Cell Mol Med. 2021. PMID: 34626063 Free PMC article. - Single-Nucleus RNA Sequencing Identifies New Classes of Proximal Tubular Epithelial Cells in Kidney Fibrosis.
Lu YA, Liao CT, Raybould R, Talabani B, Grigorieva I, Szomolay B, Bowen T, Andrews R, Taylor PR, Fraser D. Lu YA, et al. J Am Soc Nephrol. 2021 Oct;32(10):2501-2516. doi: 10.1681/ASN.2020081143. Epub 2021 Jun 21. J Am Soc Nephrol. 2021. PMID: 34155061 Free PMC article. - Values of Single-Cell RNA Sequencing in Development of Cerebral Cortex.
Chang E, Ruan X, Zhu R, Wang Y, Zhang J. Chang E, et al. Adv Exp Med Biol. 2020;1255:231-247. doi: 10.1007/978-981-15-4494-1_19. Adv Exp Med Biol. 2020. PMID: 32949404 Review. - Kidney and organoid single-cell transcriptomics: the end of the beginning.
Wilson PC, Humphreys BD. Wilson PC, et al. Pediatr Nephrol. 2020 Feb;35(2):191-197. doi: 10.1007/s00467-018-4177-y. Epub 2019 Jan 4. Pediatr Nephrol. 2020. PMID: 30607565 Free PMC article. Review.
Cited by
- scSensitiveGeneDefine: sensitive gene detection in single-cell RNA sequencing data by Shannon entropy.
Chen Z, Yang Z, Yuan X, Zhang X, Hao P. Chen Z, et al. BMC Bioinformatics. 2021 Apr 22;22(1):211. doi: 10.1186/s12859-021-04136-1. BMC Bioinformatics. 2021. PMID: 33888056 Free PMC article. - Multi-omics Analyses Reveal Function of Apolipoprotein E in Alternative Splicing and Tumor Immune Microenvironment in Kidney Renal Clear Cell Carcinoma via Pan-cancer Analysis.
Leng X, Liu J, Jin A, Zheng H, Wu J, Zhong L, Li Q, Li D. Leng X, et al. Cell Biochem Biophys. 2024 Mar;82(1):1-13. doi: 10.1007/s12013-023-01211-7. Epub 2024 Jan 6. Cell Biochem Biophys. 2024. PMID: 38182861 - Identification of Genetic Predisposition in Noncirrhotic Portal Hypertension Patients With Multiple Renal Cysts by Integrated Analysis of Whole-Genome and Single-Cell RNA Sequencing.
Wu Y, Wu Y, Liu K, Liu H, Wang S, Huang J, Ding H. Wu Y, et al. Front Genet. 2021 Nov 12;12:775470. doi: 10.3389/fgene.2021.775470. eCollection 2021. Front Genet. 2021. PMID: 34868264 Free PMC article. - Identification and Validation of Prognostic Biomarkers Specifically Expressed in Macrophage in IgA Nephropathy Patients Based on Integrated Bioinformatics Analyses.
Ding Y, Li H, Xu L, Wang Y, Yang H. Ding Y, et al. Front Mol Biosci. 2022 May 5;9:884588. doi: 10.3389/fmolb.2022.884588. eCollection 2022. Front Mol Biosci. 2022. PMID: 35601837 Free PMC article. - Selecting gene features for unsupervised analysis of single-cell gene expression data.
Sheng J, Li WV. Sheng J, et al. Brief Bioinform. 2021 Nov 5;22(6):bbab295. doi: 10.1093/bib/bbab295. Brief Bioinform. 2021. PMID: 34351383 Free PMC article. Review.
References
Publication types
MeSH terms
LinkOut - more resources
Full Text Sources
Molecular Biology Databases


