Isolation of an archaeon at the prokaryote-eukaryote interface - PubMed (original) (raw)
. 2020 Jan;577(7791):519-525.
doi: 10.1038/s41586-019-1916-6. Epub 2020 Jan 15.
Masaru K Nobu # 2, Nozomi Nakahara 3 4 5, Yuki Morono 6, Miyuki Ogawara 3, Yoshihiro Takaki 3, Yoshinori Takano 7, Katsuyuki Uematsu 8, Tetsuro Ikuta 9, Motoo Ito 6, Yohei Matsui 10, Masayuki Miyazaki 3, Kazuyoshi Murata 11, Yumi Saito 3, Sanae Sakai 3, Chihong Song 11, Eiji Tasumi 3, Yuko Yamanaka 3, Takashi Yamaguchi 5, Yoichi Kamagata 4, Hideyuki Tamaki 4, Ken Takai 3 12
Affiliations
- PMID: 31942073
- PMCID: PMC7015854
- DOI: 10.1038/s41586-019-1916-6
Isolation of an archaeon at the prokaryote-eukaryote interface
Hiroyuki Imachi et al. Nature. 2020 Jan.
Abstract
The origin of eukaryotes remains unclear1-4. Current data suggest that eukaryotes may have emerged from an archaeal lineage known as 'Asgard' archaea5,6. Despite the eukaryote-like genomic features that are found in these archaea, the evolutionary transition from archaea to eukaryotes remains unclear, owing to the lack of cultured representatives and corresponding physiological insights. Here we report the decade-long isolation of an Asgard archaeon related to Lokiarchaeota from deep marine sediment. The archaeon-'Candidatus Prometheoarchaeum syntrophicum' strain MK-D1-is an anaerobic, extremely slow-growing, small coccus (around 550 nm in diameter) that degrades amino acids through syntrophy. Although eukaryote-like intracellular complexes have been proposed for Asgard archaea6, the isolate has no visible organelle-like structure. Instead, Ca. P. syntrophicum is morphologically complex and has unique protrusions that are long and often branching. On the basis of the available data obtained from cultivation and genomics, and reasoned interpretations of the existing literature, we propose a hypothetical model for eukaryogenesis, termed the entangle-engulf-endogenize (also known as E3) model.
Conflict of interest statement
The authors declare no competing interests.
Figures
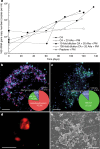
Fig. 1. Growth curves and photomicrographs of the cultured Lokiarchaeota strain MK-D1.
a, Growth curves of MK-D1 in anaerobic medium supplemented with casamino acids (CA) alone; casamino acids with 20 amino acids (AAs) and powdered milk (PM); or peptone with powdered milk. Results are also shown for cultures fed with 10- and 100-fold dilution of casamino acids, 20 amino acids and powdered milk. b, c, Fluorescence images of cells from enrichment cultures after 8 (b) and 11 (c) transfers stained with DAPI (violet) and hybridized with nucleotide probes that target MK-D1 (green) and Bacteria (red). Pie charts show the relative abundance of microbial populations based on SSU rRNA gene-tag sequencing (iTAG) analysis. d, A fluorescence image of cells from enrichment cultures after 11 transfers hybridized with nucleotide probes that target MK-D1 (green) and Methanogenium (red). The FISH experiments were performed three times with similar results. e, SEM image of a highly purified co-culture of MK-D1 and Methanogenium. White arrows indicate Methanogenium cells. We observed four different co-cultures with Methanogenium. Representative of n = 40 recorded images. The detailed iTAG-based community compositions of cultures corresponding to each of the images are shown in Supplementary Table 1. Scale bars, 10 μm (b, c) and 5 μm (d, e).
Fig. 2. Syntrophic amino acid utilization of MK-D1.
a, Genome-based metabolic reconstruction of MK-D1. Metabolic pathways identified (coloured or black) and not identified (grey) are shown. For identified pathways, each step (solid line) or process (dotted) is marked by whether it is oxidative (red), reductive (blue), ATP-yielding (orange) or ATP-consuming (purple). Wavy arrows indicate exchange of compounds: formate, H2, amino acids, vitamin B12, biotin, lipoate and thiamine pyrophosphate (TPP), which are predicted to be metabolized or synthesized by the partnering Halodesulfovibrio and/or Methanogenium. Biosynthetic pathways are indicated with a yellow background. Metatranscriptomics-detected amino-acid-catabolizing pathways are indicated (black dots above amino acids). DHDH, 4,5-dihydroxy-2,6-dioxohexanoate; DHDG, 2-dehydro-3-deoxy-
d
-gluconate; DHDG6P, 3-dehydro-3-deoxy-
d
-gluconate 6-phosphate; Ac-CoA, acetyl-CoA; uro, urocanate; Fo-Glu, formyl glutamate; CH3=H4F, methylene-tetrahydrofolate; CH≡H4F, methenyl-tetrahydrofolate; Fo-H4F, formyl-tetrahydrofolate; 2OB, 2-oxobutyrate; Prop-CoA, propionyl-CoA; ACAC, acetoacetate; GB-CoA, γ-amino-butyryl-CoA; But-CoA, butyryl-CoA; Fd, ferredoxin; XSH/X-S-S-X, thiol/disulfide pair; TCA, tricarboxylic acid cycle; PPP, pentose-phosphate pathway. b–e, NanoSIMS analysis of a highly purified MK-D1 culture incubated with a mixture of 13C- and 15N-labelled amino acids. b, Green fluorescent micrograph of SYBR Green I-stained cells. Aggregates are MK-D1, and filamentous cells are Methanobacterium sp. strain MO-MB1 (fluorescence can be weak owing to the high rigidity and low permeability of the cell membrane (Extended Data Fig. 2m, n; see also ref. ). c, NanoSIMS ion image of 12C (cyan). d, NanoSIMS ion image of 12C15N/12C14N (magenta). e, Overlay image of b–d. d, The colour bar indicates the relative abundance of 15N expressed as 15N/14N. Scale bars 5 μm. The NanoSIMS analysis was performed without replicates due to its slow growth rate and low cell density. However, to ensure the reproducibility, we used two different types of highly purified cultures of MK-D1 (see Methods). Representative of n = 8 recorded images. The iTAG analysis of the imaged culture is shown in Supplementary Table 1.
Fig. 3. Microscopy characterization and lipid composition of MK-D1.
a–c, SEM images of MK-D1. Single cell (a), aggregated cells covered with EPS-like materials (b) and a dividing cell with polar chains of blebs (c). d, Cryo-electron tomography image of MK-D1. The top-right inset image shows a magnification of the boxed area to show the cell envelope structure. e, Cryo-EM image of large membrane vesicles attached to and surrounding MK-D1 cells. f, Ultrathin section of an MK-D1 cell and a membrane vesicle. The bottom-right inset image shows a magnified view of the membrane vesicle. g, h, SEM images of MK-D1 cells producing long branching (g) and straight (h) membrane protrusions. i, Ultrathin section of a MK-D1 cell with protrusions. j, A total ion chromatogram of gas chromatography–mass spectrometry (GC–MS) for lipids extracted from a highly purified MK-D1 culture. The chemical structures of isoprenoids and their relative compositions are also shown (Supplementary Fig. 2). Scale bars, 1 μm (b, c, g, h), 500 nm (a, d, e, i) and 200 nm (f). a–c, g, h, SEM images are representative of n = 122 recorded images that were obtained from four independent observations from four culture samples. d, e, Cryo-EM images are representative of n = 14 recorded images that were taken from two independent observations from two culture samples. f, i, The ultrathin section images are representative of n = 131 recorded images that were obtained from six independent observations from six culture samples. White arrows in the images indicate large membrane vesicles. The lipid composition experiments were repeated twice and gave similar results. Detailed iTAG-based community compositions of the cultures are shown in Supplementary Table 1.
Fig. 4. Phylogeny of MK-D1 and catabolic features of Asgard archaea.
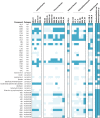
a, Maximum-likelihood tree (100 bootstrap replicates) of MK-D1 and select cultured archaea, eukaryotes and bacteria based on 31 ribosomal proteins that are conserved across the three domains (Supplementary Tables 7, 8). Bootstrap values around critical branching points are also shown. We used 14,024 sites of the alignment for tree construction. b, The presence or absence of amino acid degradation, electron metabolism, fermentation, C1 metabolism, sulfur metabolism and aerobic respiration in individual genomes are shown (complete pathway, full circle; mostly complete pathway, half circle). For amino acid metabolism, pathways that are exclusively used for catabolism or degradation are in bold. Glycine metabolism through pyruvate (top) or formate (bottom). Butyrate metabolism is reversible (fermentation or β-oxidation); however, butyryl-CoA dehydrogenases tend to be associated with EtfAB in the genomes, suggesting formation of an electron-confurcating complex for butyrate fermentation. Propionate was determined by the presence of methylmalonyl-CoA decarboxylase, biotin carboxyl carrier protein and pyruvate carboxylase. Propionate metabolism is also reversible; however, no member of the Asgard archaea encodes the full gene set for syntrophic degradation. Alcohol dehydrogenases can have diverse substrate specificities. See Supplementary Note 5 for abbreviations.
Fig. 5. Proposed hypothetical model for eukaryogenesis.
a, The syntrophic/fermentative host archaeon is suggested to degrade amino acids to short-chain fatty acids and H2, possibly by interacting with H2-scavenging (and indirectly O2-scavenging) SRB (orange; see Supplementary Note 6). b, The host may have further interacted with a facultatively aerobic organotrophic partner that could scavenge toxic O2 (the future mitochondrion; red). Continued interaction with SRB could have been beneficial but not necessarily essential; dotted arrows indicate the interaction; see Supplementary Note 7. c, Host external structures could have interacted (for example, mechanical or biological fusion) with the aerobic partner to enhance physical interaction and further engulf the partner for simultaneous development of endosymbiosis and a primitive nucleoid-bounding membrane. d, After engulfment, the host and symbiont could have continued the interaction shown in b as a primitive type of endosymbiosis. e, Development of ADP/ATP carrier (AAC) by the endosymbiont (initial direction of ATP transport remains unclear; see Supplementary Note 9). f, Endogenization of partner symbiosis by the host through delegation of catabolism and ATP generation to the endosymbiont and establishment of a symbiont-to-host ATP channel.
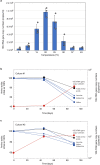
Extended Data Fig. 1. Growth of MK-D1.
a, Effect of temperature on growth of MK-D1. Data are mean ± s.d. of triplicate determinations. Each data point is shown as a dot. The temperature range test was performed twice with similar results. b, c, The amino acid concentrations and growth curves of MK-D1 in pure cocultures at 20 °C. Results from cultures 1 (b) and 2 (c) are shown. Please note that the initial concentrations of amino acids were normalized to 100%. Total amino acids and several representative amino acids (Val, valine; Leu, leucine; Ile, isoleucine) are independently shown for the duplicate culture samples. Detailed iTAG-based community compositions of the cultures are shown in Supplementary Table 1.
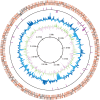
Extended Data Fig. 2. Circular representation of MK-D1 genome.
From the outside to the centre: the distribution of the coding sequences based on the conserved (orange) or non-conserved (grey) genes in the first circle, non-coding RNAs in the second circle, GC content showing deviation from average (40.7%) in the third circle, and GC skew in the fourth circle. The GC content and GC skew were calculated using a sliding window of 2 kb in step of 10 kb. The coding sequences and RNA genes illustrate the findings for plus and minus strands.
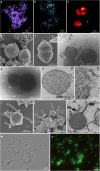
Extended Data Fig. 3. Other representative photomicrographs of MK-D1 cultures and Methanobacterium sp. strain MO-MB1.
a, b, Fluorescence images of cells from enrichment cultures after 8 (a) and 11 (b) transfers stained with DAPI (violet) and hybridized with nucleotide probes that target MK-D1 (green) and Bacteria (red). The images are different fields of view to those shown in Fig. 1b, c, which were taken at the same time. c, A fluorescence image of cells in the enrichments after 11 transfers hybridized with nucleotide probes that target MK-D1 (green) and Archaea (but with one mismatch against MK-D1; red). Large and irregular coccoid-shaped cells stained by only ARC915 are probably Methanogenium. d, e, Dividing cells of MK-D1 with a bleb. The top-right inset image in e shows a magnification of the bleb. f, g, Cryo-EM images of MK-D1 cells and large membrane vesicles (white arrows). h, i, Ultrathin sections of MK-D1 cells with a membrane vesicle. The image i shows a magnified image of h. j, k, SEM images of MK-D1 cells with protrusions. l, Ultrathin section of a MK-D1 cell with a protrusion. m, n, Photomicrographs of pure culture of Methanobacterium sp. strain MO-MB1 cells stained with SYBR Green I. Phase-contrast (m) and fluorescence (n) images of the same field are shown. a, b, The FISH experiments were performed three times with similar results. d, e, j, k, The SEM images are representative of n = 122 recorded images that were obtained from four independent observations from four culture samples. The lipid composition experiments were repeated twice and gave similar results. f, g, The cryo-EM images are representative of n = 14 recorded images that were taken from two independent observations from two culture samples. h, i, l, The ultrathin-section images are representative of n = 131 recorded images that were obtained from six independent observations from six culture samples. m, n, The SYBR Green I staining experiment was performed once, but all 10 recorded images showed similar results. Detailed iTAG analyses of cultures are shown in Supplementary Table 1.
Extended Data Fig. 4. Ribosomal protein- and 16S rRNA gene-based phylogeny of MK-D1.
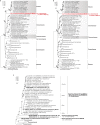
a, Phylogenomic tree of MK-D1 and select cultured archaea, eukaryotes and bacteria based on 31 ribosomal proteins conserved across the three domains (Supplementary Table 7). Ribosomal protein sequences of MK-D1, the organisms shown in the tree and MAGs of uncultured archaeal lineages (Supplementary Table 8) were aligned individually using MAFFT. MAG-derived sequences (except for Ca. Korarchaeum) were then removed for tree construction. After removing all-gap positions and concatenation, the maximum-likelihood tree was constructed using RAxML-NG. Bootstrap values around critical branching points are also shown. In total, 14,875 sites of the alignment were used for tree construction. b, A ribosomal protein-based phylogenomic tree constructed using MrBayes. Bayesian inference phylogenies were calculated using MrBayes 3.2.7a and a ribosomal protein concatenated alignment used for Fig. 4a. c, Phylogenetic tree of MK-D1 and related archaea based on 16S rRNA genes. The 16S rRNA gene sequences were aligned using SINA against the Silva v.132 alignment and the maximum-likelihood tree was calculated using RAxML.
Extended Data Fig. 5. Amino acid, cofactor and nucleotide biosynthesis capacities of MK-D1 and other Asgard archaea.
Genomes that encode proteins for the synthesis of amino acids, cofactors and nucleotides from pyruvate or acetyl-CoA (dark blue) and synthesis from other intermediates (light blue) are indicated. Those without complete pathways from pyruvate and/or acetyl-CoA are indicated in white. Halodesulfovibrio sp. strain MK-HDV and Methanogenium sp. strain MK-MG isolated in this study are also shown.
Extended Data Fig. 6. Maximum-likelihood tree of Asgard archaea urocanate hydratase.
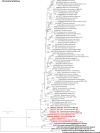
Urocanate hydratase (HutU) homologues were obtained by BLASTp analysis of the Asgard archaea sequences against the UniProt database (release 2019_06). Of homologues with sequence similarity ≥40% and overlap ≥70%, representative sequences were selected using CD-HIT with a clustering cut-off of 70% similarity (otherwise default settings were used). Additional homologues with verified biochemical activity, sequence similarity ≥30% and overlap ≥70% were obtained by BLASTp analysis of the Asgard archaea sequences against the UniProt/SwissProt database (2019_05). Sequences were aligned using MAFFT v.7 with default settings and trimmed using trimAl v.1.2 with default settings. The maximum-likelihood tree was constructed using RAxML-NG using fixed empirical substitution matrix (LG), 4 discrete GAMMA categories, empirical amino acid frequencies from the alignment and 100 bootstrap replicates. In total, 876 sites of the alignment were used for tree construction.
Extended Data Fig. 7. Maximum-likelihood tree of Asgard archaea l-threonine/l-serine dehydratase.
a, Tree calculated for target Asgard archaea
l
-threonine/
l
-serine dehydratase (TdcB) and homologues. TdcB homologues were obtained by BLASTp analysis of the Asgard archaea sequences against the UniProt reference proteome and SwissProt database (release 2019_06). Of homologues with sequence similarity ≥40%, overlap ≥70% and predicted prosite domain PS00165 (serine/threonine dehydratases pyridoxal-phosphate attachment site), representative sequences were selected using CD-HIT with a clustering cut-off of 70% similarity (otherwise default settings were used). Additional homologues with verified biochemical activity, sequence similarity ≥30% and overlap ≥70% were obtained by BLASTp analysis of the Asgard archaea sequences against the UniProt/SwissProt database (2019_05). Sequences were aligned using MAFFT v.7 with default settings. Positions with gaps in more than 10% of the sequences were excluded from the alignment using trimAl v.1.2 (-gt 0.9; and otherwise default settings were used). The maximum-likelihood tree was constructed using PhyML using a fixed empirical substitution matrix (LG), 4 discrete GAMMA categories, empirical amino acid frequencies from the alignment and 100 bootstrap replicates (-b 100 -d aa -m LG -v e). In total, 308 sites of the alignment were used for tree construction. b, Tree calculated for a subset of sequences contained in a section of the original tree (branches that are coloured blue). Sequences were realigned and trimmed as described for a. In total, 308 sites of the alignment were used for tree construction.
Comment in
- Meet the relatives of our cellular ancestor.
Schleper C, Sousa FL. Schleper C, et al. Nature. 2020 Jan;577(7791):478-479. doi: 10.1038/d41586-020-00039-y. Nature. 2020. PMID: 31965093 No abstract available. - Asgard archaeon rises from the mud.
Hofer U. Hofer U. Nat Rev Microbiol. 2020 Mar;18(3):122-123. doi: 10.1038/s41579-020-0334-y. Nat Rev Microbiol. 2020. PMID: 31988492 No abstract available. - Cultured Asgard Archaea Shed Light on Eukaryogenesis.
López-García P, Moreira D. López-García P, et al. Cell. 2020 Apr 16;181(2):232-235. doi: 10.1016/j.cell.2020.03.058. Cell. 2020. PMID: 32302567 - The mysterious microbes that gave rise to complex life.
Dance A. Dance A. Nature. 2021 May;593(7859):328-330. doi: 10.1038/d41586-021-01316-0. Nature. 2021. PMID: 34012090 No abstract available. - Origin of eukaryotes: What can be learned from the first successfully isolated Asgard archaeon.
Albers S, Ashmore J, Pollard T, Spang A, Zhou J. Albers S, et al. Fac Rev. 2022 Jan 27;11:3. doi: 10.12703/r-01-000005. eCollection 2022. Fac Rev. 2022. PMID: 35174363 Free PMC article.
Similar articles
- Promethearchaeum syntrophicum gen. nov., sp. nov., an anaerobic, obligately syntrophic archaeon, the first isolate of the lineage 'Asgard' archaea, and proposal of the new archaeal phylum Promethearchaeota phyl. nov. and kingdom Promethearchaeati regn. nov.
Imachi H, Nobu MK, Kato S, Takaki Y, Miyazaki M, Miyata M, Ogawara M, Saito Y, Sakai S, Tahara YO, Takano Y, Tasumi E, Uematsu K, Yoshimura T, Itoh T, Ohkuma M, Takai K. Imachi H, et al. Int J Syst Evol Microbiol. 2024 Jul;74(7):006435. doi: 10.1099/ijsem.0.006435. Int J Syst Evol Microbiol. 2024. PMID: 38967634 - Inference and reconstruction of the heimdallarchaeial ancestry of eukaryotes.
Eme L, Tamarit D, Caceres EF, Stairs CW, De Anda V, Schön ME, Seitz KW, Dombrowski N, Lewis WH, Homa F, Saw JH, Lombard J, Nunoura T, Li WJ, Hua ZS, Chen LX, Banfield JF, John ES, Reysenbach AL, Stott MB, Schramm A, Kjeldsen KU, Teske AP, Baker BJ, Ettema TJG. Eme L, et al. Nature. 2023 Jun;618(7967):992-999. doi: 10.1038/s41586-023-06186-2. Epub 2023 Jun 14. Nature. 2023. PMID: 37316666 Free PMC article. - Asgard archaea illuminate the origin of eukaryotic cellular complexity.
Zaremba-Niedzwiedzka K, Caceres EF, Saw JH, Bäckström D, Juzokaite L, Vancaester E, Seitz KW, Anantharaman K, Starnawski P, Kjeldsen KU, Stott MB, Nunoura T, Banfield JF, Schramm A, Baker BJ, Spang A, Ettema TJ. Zaremba-Niedzwiedzka K, et al. Nature. 2017 Jan 19;541(7637):353-358. doi: 10.1038/nature21031. Epub 2017 Jan 11. Nature. 2017. PMID: 28077874 - The Syntrophy hypothesis for the origin of eukaryotes revisited.
López-García P, Moreira D. López-García P, et al. Nat Microbiol. 2020 May;5(5):655-667. doi: 10.1038/s41564-020-0710-4. Epub 2020 Apr 27. Nat Microbiol. 2020. PMID: 32341569 Review. - The emerging view on the origin and early evolution of eukaryotic cells.
Vosseberg J, van Hooff JJE, Köstlbacher S, Panagiotou K, Tamarit D, Ettema TJG. Vosseberg J, et al. Nature. 2024 Sep;633(8029):295-305. doi: 10.1038/s41586-024-07677-6. Epub 2024 Sep 11. Nature. 2024. PMID: 39261613 Review.
Cited by
- Expanded diversity of Asgard archaea and their relationships with eukaryotes.
Liu Y, Makarova KS, Huang WC, Wolf YI, Nikolskaya AN, Zhang X, Cai M, Zhang CJ, Xu W, Luo Z, Cheng L, Koonin EV, Li M. Liu Y, et al. Nature. 2021 May;593(7860):553-557. doi: 10.1038/s41586-021-03494-3. Epub 2021 Apr 28. Nature. 2021. PMID: 33911286 Free PMC article. - Crystal structure of schizorhodopsin reveals mechanism of inward proton pumping.
Higuchi A, Shihoya W, Konno M, Ikuta T, Kandori H, Inoue K, Nureki O. Higuchi A, et al. Proc Natl Acad Sci U S A. 2021 Apr 6;118(14):e2016328118. doi: 10.1073/pnas.2016328118. Proc Natl Acad Sci U S A. 2021. PMID: 33790007 Free PMC article. - Medusavirus Ancestor in a Proto-Eukaryotic Cell: Updating the Hypothesis for the Viral Origin of the Nucleus.
Takemura M. Takemura M. Front Microbiol. 2020 Sep 3;11:571831. doi: 10.3389/fmicb.2020.571831. eCollection 2020. Front Microbiol. 2020. PMID: 33013805 Free PMC article. - Ten Years of Collaborative Progress in the Quest for Orthologs.
Linard B, Ebersberger I, McGlynn SE, Glover N, Mochizuki T, Patricio M, Lecompte O, Nevers Y, Thomas PD, Gabaldón T, Sonnhammer E, Dessimoz C, Uchiyama I; QFO Consortium. Linard B, et al. Mol Biol Evol. 2021 Jul 29;38(8):3033-3045. doi: 10.1093/molbev/msab098. Mol Biol Evol. 2021. PMID: 33822172 Free PMC article. - Eukaryogenesis and oxygen in Earth history.
Mills DB, Boyle RA, Daines SJ, Sperling EA, Pisani D, Donoghue PCJ, Lenton TM. Mills DB, et al. Nat Ecol Evol. 2022 May;6(5):520-532. doi: 10.1038/s41559-022-01733-y. Epub 2022 Apr 21. Nat Ecol Evol. 2022. PMID: 35449457 Review.
References
- Eme L, Spang A, Lombard J, Stairs CW, Ettema TJG. Archaea and the origin of eukaryotes. Nat. Rev. Microbiol. 2017;15:711–723. - PubMed
Publication types
MeSH terms
Substances
LinkOut - more resources
Full Text Sources
Other Literature Sources
