The hornwort genome and early land plant evolution - PubMed (original) (raw)
doi: 10.1038/s41477-019-0588-4. Epub 2020 Feb 10.
Xin-Xing Fu # 1 2, Rui-Qi Li # 1, Xiang Zhao # 3, Yang Liu # 4 5, Ming-He Li # 6, Arthur Zwaenepoel # 7 8, Hong Ma 9, Bernard Goffinet 10, Yan-Long Guan 11, Jia-Yu Xue 12, Yi-Ying Liao 4 13, Qing-Feng Wang 13, Qing-Hua Wang 1, Jie-Yu Wang 6 14, Guo-Qiang Zhang 6, Zhi-Wen Wang 3, Yu Jia 1, Mei-Zhi Wang 1, Shan-Shan Dong 4, Jian-Fen Yang 4, Yuan-Nian Jiao 1, Ya-Long Guo 1, Hong-Zhi Kong 1, An-Ming Lu 1, Huan-Ming Yang 5, Shou-Zhou Zhang 15, Yves Van de Peer 16 17 18 19, Zhong-Jian Liu 20 21 22, Zhi-Duan Chen 23 24
Affiliations
- PMID: 32042158
- PMCID: PMC7027989
- DOI: 10.1038/s41477-019-0588-4
The hornwort genome and early land plant evolution
Jian Zhang et al. Nat Plants. 2020 Feb.
Abstract
Hornworts, liverworts and mosses are three early diverging clades of land plants, and together comprise the bryophytes. Here, we report the draft genome sequence of the hornwort Anthoceros angustus. Phylogenomic inferences confirm the monophyly of bryophytes, with hornworts sister to liverworts and mosses. The simple morphology of hornworts correlates with low genetic redundancy in plant body plan, while the basic transcriptional regulation toolkit for plant development has already been established in this early land plant lineage. Although the Anthoceros genome is small and characterized by minimal redundancy, expansions are observed in gene families related to RNA editing, UV protection and desiccation tolerance. The genome of A. angustus bears the signatures of horizontally transferred genes from bacteria and fungi, in particular of genes operating in stress-response and metabolic pathways. Our study provides insight into the unique features of hornworts and their molecular adaptations to live on land.
Conflict of interest statement
The authors declare no competing financial interests.
Figures
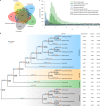
Fig. 1. Comparative genomic analysis of A. angustus and 18 other plant species.
a, Comparison of the number of gene families identified by OrthoMCL. The Venn diagram shows the shared and unique gene families in A. angustus, Setaphyta, Tracheophyta, Charophyta and Chlorophyta. The gene-family number is listed in each of the components. b, Gene-family gain (+)/loss (−) among 19 green plants. The numbers of gained (blue) and lost (red) gene families are shown above the branches. The boxed number indicates the gene-family size at each node. The number of gene families, orphans (single-copy gene families) and number of predicted genes is indicated next to each species. c, Comparison of whole paranome, anchor pair and one-to-one orthologue distribution of the number of synonymous substitutions per synonymous site (_K_S) across the three bryophyte species (P. patens, M. polymorpha and A. angustus).
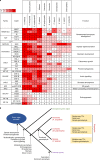
Fig. 2. Major TFs for plant body plan and evolutionary innovations within plants.
a, Overview for the number of major TFs for plant body plan in ten green plants. Colour key on the upper left of the heatmap denotes the TF numbers. b, Major innovations in plants and evolutionary features of three bryophyte lineages.
Fig. 3. Expansion of cupin gene family in A. angustus.
a, A summary of the number of cupin genes from nine species based on a Pfam search of cupin_1 domain (PF00190). b,c, Phylogenetic trees show cupin genes in nine plant genomes: bicupins (b) and monocupins (c). The colour of each branch corresponds to the background colour for each species in a. The tandem duplicated gene clusters are ordered and shown on scaffolds of the A. angustus genome. The scale bars in the trees show the number of amino acid substitutions per site.
Fig. 4. Phylogenetic affinities of genes horizontally transferred to A. angustus.
a, Phylogenetic tree of glyoxalase (PF13468). b, Phylogenetic tree of NAD-binding dehydrogenase (PF08635). c, Phylogenetic tree of glucuronyl hydrolase (PF07470). d, Phylogenetic tree of DNA methyltransferase (PF02870 and PF01035). The stars indicate that the Anthoceros sequence or bryophyte sequences formed a monophyletic clade with homologues of putative HGT donor, reflecting _Anthoceros_-specific or bryophyte-specific HGT events. Maximum-likelihood bootstrap support values ≥50% are shown above the branches. Red, hornworts and other bryophytes; cyan, green algae; grey, metazoan; orange, stramenopiles; blue, bacteria; yellow, fungi; purple, archaea. The homologues from the kingdom other than the one that HGT donors are involved in are used as the outgroup. The scale bars in the trees show the number of amino acid substitutions per site.
Similar articles
- Anthoceros genomes illuminate the origin of land plants and the unique biology of hornworts.
Li FW, Nishiyama T, Waller M, Frangedakis E, Keller J, Li Z, Fernandez-Pozo N, Barker MS, Bennett T, Blázquez MA, Cheng S, Cuming AC, de Vries J, de Vries S, Delaux PM, Diop IS, Harrison CJ, Hauser D, Hernández-García J, Kirbis A, Meeks JC, Monte I, Mutte SK, Neubauer A, Quandt D, Robison T, Shimamura M, Rensing SA, Villarreal JC, Weijers D, Wicke S, Wong GK, Sakakibara K, Szövényi P. Li FW, et al. Nat Plants. 2020 Mar;6(3):259-272. doi: 10.1038/s41477-020-0618-2. Epub 2020 Mar 13. Nat Plants. 2020. PMID: 32170292 Free PMC article. - The hornworts: morphology, evolution and development.
Frangedakis E, Shimamura M, Villarreal JC, Li FW, Tomaselli M, Waller M, Sakakibara K, Renzaglia KS, Szövényi P. Frangedakis E, et al. New Phytol. 2021 Jan;229(2):735-754. doi: 10.1111/nph.16874. Epub 2020 Sep 15. New Phytol. 2021. PMID: 32790880 Free PMC article. Review. - Genome-wide organellar analyses from the hornwort Leiosporoceros dussii show low frequency of RNA editing.
Villarreal A JC, Turmel M, Bourgouin-Couture M, Laroche J, Salazar Allen N, Li FW, Cheng S, Renzaglia K, Lemieux C. Villarreal A JC, et al. PLoS One. 2018 Aug 8;13(8):e0200491. doi: 10.1371/journal.pone.0200491. eCollection 2018. PLoS One. 2018. PMID: 30089117 Free PMC article. - The plastid genome of the hornwort Nothoceros aenigmaticus (Dendrocerotaceae): phylogenetic signal in inverted repeat expansion, pseudogenization, and intron gain.
Villarreal JC, Forrest LL, Wickett N, Goffinet B. Villarreal JC, et al. Am J Bot. 2013 Mar;100(3):467-77. doi: 10.3732/ajb.1200429. Epub 2013 Feb 15. Am J Bot. 2013. PMID: 23416362 - Major transitions in the evolution of early land plants: a bryological perspective.
Ligrone R, Duckett JG, Renzaglia KS. Ligrone R, et al. Ann Bot. 2012 Apr;109(5):851-71. doi: 10.1093/aob/mcs017. Epub 2012 Feb 22. Ann Bot. 2012. PMID: 22356739 Free PMC article. Review.
Cited by
- An Agrobacterium-mediated stable transformation technique for the hornwort model Anthoceros agrestis.
Frangedakis E, Waller M, Nishiyama T, Tsukaya H, Xu X, Yue Y, Tjahjadi M, Gunadi A, Van Eck J, Li FW, Szövényi P, Sakakibara K. Frangedakis E, et al. New Phytol. 2021 Nov;232(3):1488-1505. doi: 10.1111/nph.17524. Epub 2021 Jul 19. New Phytol. 2021. PMID: 34076270 Free PMC article. - The first step into phenolic metabolism in the hornwort Anthoceros agrestis: molecular and biochemical characterization of two phenylalanine ammonia-lyase isoforms.
Pezeshki S, Warmbier I, Busch T, Bauerbach E, Szövenyi P, Petersen M. Pezeshki S, et al. Planta. 2022 Jul 7;256(2):33. doi: 10.1007/s00425-022-03944-w. Planta. 2022. PMID: 35796843 Free PMC article. - Evolutionary Origins of Drought Tolerance in Spermatophytes.
Bowles AMC, Paps J, Bechtold U. Bowles AMC, et al. Front Plant Sci. 2021 Jun 22;12:655924. doi: 10.3389/fpls.2021.655924. eCollection 2021. Front Plant Sci. 2021. PMID: 34239520 Free PMC article. - Genome-wide identification and characterization of COMT gene family during the development of blueberry fruit.
Liu Y, Wang Y, Pei J, Li Y, Sun H. Liu Y, et al. BMC Plant Biol. 2021 Jan 6;21(1):5. doi: 10.1186/s12870-020-02767-9. BMC Plant Biol. 2021. PMID: 33407129 Free PMC article. - Water-related innovations in land plants evolved by different patterns of gene cooption and novelty.
Bowles AMC, Paps J, Bechtold U. Bowles AMC, et al. New Phytol. 2022 Jul;235(2):732-742. doi: 10.1111/nph.17981. Epub 2022 Feb 8. New Phytol. 2022. PMID: 35048381 Free PMC article.
References
- Goffinet, B. & Buck, W. R. in The Evolution of Plant Form (eds Ambrose, B. & Purruganan, M.) 51–90 (Wiley–Blackwell, 2013).
- von Konrat M, Shaw AJ, Renzaglia KS. A special issue of Phytotaxa dedicated to bryophytes: the closest living relatives of early land plants. Phytotaxa. 2010;9:5–10. doi: 10.11646/phytotaxa.9.1.3. - DOI
- Christenhusz MJM, Byng JW. The number of known plants species in the world and its annual increase. Phytotaxa. 2016;261:201–217. doi: 10.11646/phytotaxa.261.3.1. - DOI
Publication types
MeSH terms
LinkOut - more resources
Full Text Sources


