Electroacupuncture and Moxibustion Regulate Hippocampus Glia and Mitochondria Activation in DSS-Induced Colitis Mice - PubMed (original) (raw)
Electroacupuncture and Moxibustion Regulate Hippocampus Glia and Mitochondria Activation in DSS-Induced Colitis Mice
Ning Zhang et al. Evid Based Complement Alternat Med. 2020.
Abstract
Objectives: To study the influence of electroacupuncture (EA) and moxibustion on the hippocampus astrocyte and microglia activation in the ulcerative colitis model and to evaluate the mitochondria activity.
Methods: 2.5% dextran sodium sulfate-induced colitis mice were treated by EA or moxibustion. Intestinal pathological structure was observed by hematoxylin and eosin (H&E) staining; the expression of GFAP or S100b (markers for astrocyte), Iba-1 (a marker for microglia), and Mitofilin (a marker for mitochondria) in hippocampus was detected by immunofluorescence staining or western blot.
Results: The results demonstrated that both EA and moxibustion could improve the morphology of distal colonic mucosal epithelia in DSS-induced colitis mice. Expression of GFAP in the hippocampus was significantly increased after EA or moxibustion treatment. The effects were further supported by WB results. Meanwhile, expression of mitofilin in the hippocampus CA1 and CA3 regions showed the same trend as that of GFAP. Expression of Iba-1 in the hippocampus showed no significant difference after EA or moxibustion treatment, while the state of microglia changed from resting in control mice to activated state in colitis mice.
Conclusion: EA and moxibustion were able to modulate the activation of astrocyte, microglial, and mitochondria in the hippocampus area in the colitis model.
Copyright © 2020 Ning Zhang et al.
Conflict of interest statement
The authors declare that they have no conflicts of interest regarding the publication of this study.
Figures
Figure 1
Schematic diagram for the experimental procedure. Horizontal black arrow line represents the whole experimental procedure and the key time points. The solid arrow represents the oral administration of 2.5% DSS in drinking water to induce colitis until the 14th day, and the dotted arrow represents drinking clean water as a control group. The EA or MOX treatment procedure applied to mice was started from the 5th day of DSS water administration. DSS, dextran sodium sulfate; EA, electroacupuncture; MOX, moxibustion.
Figure 2
Morphological changes in different groups. Leukocyte infiltration into the mucosa and damage to the colon wall were evident in the DSS-induced colitis group (H&E, 200x). (a) Con, control group; (b) DSS, DSS-induced colitis group; (c) DSS + MOX, moxibustion treatment group; (d) DSS + EA, electroacupuncture treatment group.
Figure 3
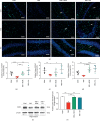
EA and moxibustion promote astrocyte activation. Labeling (a) and analysis of astrocytes in the hippocampus CA1 (b), CA3 (c), and DG (d) regions of UC mice. Green, GFAP (a marker for astroglia); blue, DAPI nuclear staining (n = 5/group). White arrow highlights the activated astrocyte. Scale bar, 50 _μ_m. (e, f) Western blot (e) and analysis (f) showing the downregulation of S100b (a marker for astroglia) expression in the hippocampus in the DSS-induced colitis group and upregulation after EA and moxibustion treatment (n = 3/group). GFAP, glial fibrillary acidic protein.
Figure 4
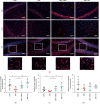
EA and moxibustion modulate microglia activation. Labeling (a) and analysis (b–d) of microglia in the hippocampus CA1 (b), CA3 (c), and DG (d) regions of UC mice. Green, Iba-1 (a marker of activated microglia); blue, DAPI nuclear staining (n = 5/group). Scale bar, 50 _μ_m. White arrow highlights the state change of microglia, from resting in control mice (faint Iba-1 staining) to activation in UC mice (DSS-induced; strong Iba-1 staining) and also improvement after EA and moxibustion treatment. Iba1, ionized calcium binding adapter molecule 1.
Figure 5
EA and moxibustion promote mitochondria activation. Representative labeling (a) and analysis (b–d) of mitochondria in the hippocampus CA1 (b), CA3 (c), and DG (d) regions of UC mice. Mitofilin (a marker of activated mitochondria); blue, DAPI nuclear staining (n = 5/group). Scale bar, 50 _μ_m. Below: enlarged views of the white frames in the above panels highlight the cytoplasmic positive expression of mitochondria in the DG region of hippocampus.
Similar articles
- Mechanism of electroacupuncture and herb-partitioned moxibustion on ulcerative colitis animal model: A study based on proteomics.
Qi Q, Zhong R, Liu YN, Zhao C, Huang Y, Lu Y, Ma Z, Zheng HD, Wu LY. Qi Q, et al. World J Gastroenterol. 2022 Jul 28;28(28):3644-3665. doi: 10.3748/wjg.v28.i28.3644. World J Gastroenterol. 2022. PMID: 36161055 Free PMC article. - Electroacupuncture and Moxibustion Improved Anxiety Behavior in DSS-Induced Colitis Mice.
Wei D, Zhao N, Xie L, Huang B, Zhuang Z, Tang Y, Yu S, Wu Q. Wei D, et al. Gastroenterol Res Pract. 2019 Feb 7;2019:2345890. doi: 10.1155/2019/2345890. eCollection 2019. Gastroenterol Res Pract. 2019. PMID: 30881446 Free PMC article. - [Effect of moxibustion on colonic mucosal injury and expression of CGRP positive nerve fibers of distal colonic mucosa in ulcerative colitis mice].
Huang R, Wu JH, Wang SL. Huang R, et al. Zhongguo Zhen Jiu. 2021 Oct 12;41(10):1127-34. doi: 10.13703/j.0255-2930.20201226-k0001. Zhongguo Zhen Jiu. 2021. PMID: 34628746 Chinese. - Electroacupuncture and moxibustion promote neutrophil apoptosis and improve ulcerative colitis in rats.
Wu HG, Liu HR, Tan LY, Gong YJ, Shi Y, Zhao TP, Yi Y, Yang Y. Wu HG, et al. Dig Dis Sci. 2007 Feb;52(2):379-84. doi: 10.1007/s10620-006-9561-y. Epub 2007 Jan 9. Dig Dis Sci. 2007. PMID: 17211698 - Regulating the Balance of Th17/Treg via Electroacupuncture and Moxibustion: An Ulcerative Colitis Mice Model Based Study.
Sun J, Zhang H, Wang C, Yang M, Chang S, Geng Y, Yang H, Zhuang Z, Wang X, Xie L, Huang B, Zhao N, Zhou W, Cheng X, Cai B, Wu Q, Yu SG. Sun J, et al. Evid Based Complement Alternat Med. 2017;2017:7296353. doi: 10.1155/2017/7296353. Epub 2017 Dec 17. Evid Based Complement Alternat Med. 2017. PMID: 29391874 Free PMC article.
Cited by
- Moxibustion Inhibits the Expression of Colonic NLRP3 through miR7/RNF183/NF-_κ_B Signaling Pathway in UC Rats.
Li XY, Yang YT, Zhao Y, Kong XH, Yang G, Hong J, Zhang D, Ma XP. Li XY, et al. Evid Based Complement Alternat Med. 2021 Nov 3;2021:6519063. doi: 10.1155/2021/6519063. eCollection 2021. Evid Based Complement Alternat Med. 2021. PMID: 34777536 Free PMC article. - Electroacupuncture Improves M2 Microglia Polarization and Glia Anti-inflammation of Hippocampus in Alzheimer's Disease.
Xie L, Liu Y, Zhang N, Li C, Sandhu AF, Williams G 3rd, Shen Y, Li H, Wu Q, Yu S. Xie L, et al. Front Neurosci. 2021 Sep 27;15:689629. doi: 10.3389/fnins.2021.689629. eCollection 2021. Front Neurosci. 2021. PMID: 34646113 Free PMC article. - The protective effects of electroacupuncture on intestinal barrier lesions in IBS and UC model.
Liu S, Huang Q, Huang Q, Wang Y, Li S, Wang J, Wu Q. Liu S, et al. Sci Rep. 2023 May 4;13(1):7276. doi: 10.1038/s41598-023-34182-z. Sci Rep. 2023. PMID: 37142764 Free PMC article. - Gut microbiome alterations in colitis rats after moxibustion at bilateral Tianshu acupoints.
Qi Q, Liu YN, Lv SY, Wu HG, Zhang LS, Cao Z, Liu HR, Wang XM, Wu LY. Qi Q, et al. BMC Gastroenterol. 2022 Feb 12;22(1):62. doi: 10.1186/s12876-022-02115-1. BMC Gastroenterol. 2022. PMID: 35151255 Free PMC article.
References
- Adams S. M., Bornemann P. H. Ulcerative colitis. American Family Physician. 2013;87(87):699–705. - PubMed
- Mokhtar N. M., Nawawi K. N. M., Verasingam J., et al. A four-decade analysis of the incidence trends, sociodemographic and clinical characteristics of inflammatory bowel disease patients at single tertiary centre, Kuala Lumpur, Malaysia. BMC Public Health. 2019;19(S4):p. 550. doi: 10.1186/s12889-019-6858-2. - DOI - PMC - PubMed
LinkOut - more resources
Full Text Sources
Miscellaneous


