Arginine-Enriched Mixed-Charge Domains Provide Cohesion for Nuclear Speckle Condensation - PubMed (original) (raw)
Arginine-Enriched Mixed-Charge Domains Provide Cohesion for Nuclear Speckle Condensation
Jamie A Greig et al. Mol Cell. 2020.
Abstract
Low-complexity protein domains promote the formation of various biomolecular condensates. However, in many cases, the precise sequence features governing condensate formation and identity remain unclear. Here, we investigate the role of intrinsically disordered mixed-charge domains (MCDs) in nuclear speckle condensation. Proteins composed exclusively of arginine-aspartic acid dipeptide repeats undergo length-dependent condensation and speckle incorporation. Substituting arginine with lysine in synthetic and natural speckle-associated MCDs abolishes these activities, identifying a key role for multivalent contacts through arginine's guanidinium ion. MCDs can synergize with a speckle-associated RNA recognition motif to promote speckle specificity and residence. MCD behavior is tunable through net-charge: increasing negative charge abolishes condensation and speckle incorporation. Contrastingly, increasing positive charge through arginine leads to enhanced condensation, speckle enlargement, decreased splicing factor mobility, and defective mRNA export. Together, these results identify key sequence determinants of MCD-promoted speckle condensation and link the dynamic material properties of speckles with function in mRNA processing.
Keywords: biomolecular condensate; intrinsically disordered protein; low-complexity domain; mRNA processing; membraneless organelle; mixed-charge domain; nuclear speckle; phase separation; ribonucleoprotein (RNP) bodies.
Copyright © 2020 Elsevier Inc. All rights reserved.
Conflict of interest statement
Declaration of Interests R.V.P. is a member of the Scientific Advisory Board of Dewpoint Therapeutics Inc. There are no competing financial or ethical conflicts to declare.
Figures
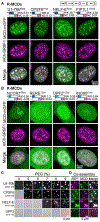
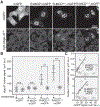
Figure 1.. RD-Dipeptide Repeats Associate with Nuclear Speckles and Undergo Condensation in a Length-Dependent Manner
(A) Representative images of nuclei in cells expressing the indicated mGFP-fusions. mCherry-SRSF1 identifies speckles. Scale bar: 5 μm. (B) In vitro condensation of RD dipeptide length variants. Condensates are found in the pellet fraction following centrifugation at 100,000 x g. Total (T), supernatant (S), and pellet (P) fractions are shown. (C) Bright-field (BF) (upper panels) and scanning electron microscopy (SEM) (lower panels) images of SPA-5MCD and RD50 condensates. Scale bars: top panel, 20 μm; bottom panel, 1 μm. (D) Quantification of the percentage of total SPA-5MCD and RD50 that pellet following condensation at the indicated protein concentrations. The mean and standard deviation from three independent experiments are shown. (E) Quantification of speckle enrichment (in vivo) and condensation (in vitro) for the indicated RD variants reveals similar length-dependency. The degree of condensation is quantified as the fraction of pelleting material as compared to the total input. Average values are derived from three experiments as shown in (B). Speckle enrichment is the average speckle signal density divided by the average nucleoplasmic signal density, with the value of one set to zero. For both data sets, the mean and standard deviation are shown. (F) FRAP recovery curves for the indicated condensates. Insets show images of representative condensates at the indicated time points. The mean and standard deviation from 5 independent experiments are shown. See also Figure S1.
Figure 2.. Naturally Occurring R-MCDs Associate with Nuclear Speckles and Undergo Phase Separation as Pure Proteins
(A) Images of representative nuclei for cells expressing the indicated R-MCD mGFP-fusions. mCherry-SRSF1 identifies speckles. Colocalization is shown in the merge panel. For each protein, MCD length is identified in superscript. Colored boxes present the relative amino acid contribution of positively (+) and negatively (−) charged amino acids and serine as identified in the legend. R/K ratio and net-charge (NC) are indicated. Scale bar: 5 μm. (B) Images of representative nuclei for cells expressing the indicated K-MCD mGFP-fusions. mCherry-SRSF1 identifies speckles. Refer to (A) for legend description. Scale bar: 5 μm. (C) In vitro phase separation of purified mGFP/mCherry-MCD fusions at the indicated PEG concentration. Condensates are identified by fluorescence microscopy. Scale bar: 4 μm. (D) Co-assembly of MCDs from (C) with mGFP/mCherry-RD50, identified as above. Scale bar: 4 μm. See also Figures S2A–S2E.
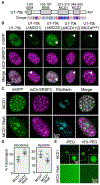
Figure 3.. Arginine in U1-70k MCDs Promotes Nuclear Speckle Incorporation and Condensate Formation
(A) Diagram of human U1-70k shows the position of the MCDs, RNA recognition motif (RRM), and GEM incorporation domain. The position of charged amino acids is shown in the lower panel. Blue, positively charged residues; red, negatively charged residues. (B) Images of representative nuclei from cells expressing the indicated U1-70k-mGFP variants. mCherry-SRSF3 identifies speckles. Arrowheads point to the GEM body. Scale bar: 5 μm. (C) Images of representative nuclei from cells expressing the indicated mGFP-fusions. Fibrillarin staining identifies nucleoli. Scale bar: 5 μm. (D) Quantification of the speckle and nucleolar signal as a fraction of the total nuclear signal for the mGFP-fusions shown in (C). Data points are shown with mean and standard deviation. ***p < 0.0001. (E) Fluorescence microscopy reveals the tendency of purified MCD1 and the MCD1 R to K variant-mGFP fusions to form condensates in the presence (+) and absence (−) of 5% PEG. The dashed box identifies the region shown magnified in the inset. Scale bars: main image, 5 μm; inset, 1 μm. See also Figures S2E–S2H.
Figure 4.. R Is Essential for Condensation and Nuclear Speckle Incorporation of MCDs
(A) Images of representative nuclei from cells expressing the indicated mGFP-fusions. mCherry-SRSF1 identifies speckles. Scale bar: 5 μm. (B) The indicated dipeptide repeat sequences were assayed for condensation as in Figure 1B. The mean and standard deviation from three independent experiments are shown. (C) Quantification of length-dependent condensation for the indicated RD and RE repeat variants as in Figure 1E. The mean and standard deviation from three independent experiments are shown. (D) BF images of the indicated condensates. Insets show SEM images. Dashed boxes indicate regions shown at higher magnification in the lower panels. Scale bars: top panel, 20 μm; bottom panel, 5 μm, insets, 1 μm. (E) Behavior of randomized mixed-charge dipeptide repeat variants conforming to R-low and R-high R/K ratios. Diagrams on the left depict the position of the indicated amino acid residues. Images on the right are of representative nuclei from cells expressing the indicated R-low (upper panels) and R-high variant (lower panels). mCherry-SRSF1 identifies speckles. Figure S4 contains full analysis of four R-low and R-high variants. Scale bar: 5 μm. (F) Quantification of speckle enrichment for the indicated sequence variants as in Figure 1E. ***p < 0.0001. Data are derived from the full set of R-low and R-high variants, shown with mean and standard deviation. (G) Quantification of in vitro condensation for the indicated MCD variants. Total (T), supernatant (S), and pellet (P) fractions are shown. The mean and standard deviation from three independent experiments are shown. See also Figures S3 and S4.
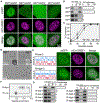
Figure 5.. An RRM Synergizes with an RS Domain or R-MCD to Specify Nuclear Speckle Incorporation
(A) Image of a representative nuclei in a cell expressing RS50-mGFP. Dashed box indicates the region magnified below. mCherry-SRSF1 identifies speckles. Scale bars: top panel, 5 μm; bottom panels, 1 μm. (B) Limited FRAP recovery of RS50-mGFP nuclear bodies as compared to RD50-mGFP and RSSRSF2-mGFP in speckles. The mean and standard deviation from 10 independent experiments are shown. (C) Western blot comparing the migration of phosphatase (PPase) treated (+) and untreated (−) RS50-mGFP (RS50) with RSSRSF2-mGFP. The difference in migration provides an estimate of the degree of phosphorylation, which is indicated in kDa. Ponceau red (PR) staining confirms equal loading. (D) Diagram showing the domain structure of the indicated mGFP-fusions. (E) Images of representative nuclei from cells expressing the indicated mGFP-fusions. Scale bar: 5 μm. (F) Quantification of the speckle- (upper panel) and nucleolar-enrichment (lower panel) of the indicated mGFP-fusions, as in Figure 1E. Nucleolar-enrichment is the average nucleolar signal density divided by the average nucleoplasmic signal density, with the value of one set to zero. (G) FRAP of speckles labeled with the indicated mGFP-fusions. The half-times for recovery along with standard deviation are shown. For all quantification, data points are shown with mean and standard deviation. *p < 0.01, ***p < 0.0001. See also Figure S5.
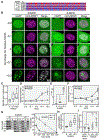
Figure 6.. Increasing MCD Net-Positive Charge through R Enhances Nuclear Speckle Cohesion
(A) Diagram of the charge distribution in sequences designed to vary net-charge per residue (NCPR) between −0.2 and +0.2. Blue, positively charged residues; red, negatively charged residues. The extent of charge mixing is indicated with the kappa (κ) value. (B) Images of representative nuclei from cells expressing the indicated mGFP-fusions. mCherry-SRSF1 identifies speckles. Scale bar: 5 μm. (C) Quantification of the fraction of nuclear area occupied by speckles for cells expressing the indicated R-MCD net-charge variants. (D) Quantification of speckle enrichment for the indicated MCD net-charge variants, as in Figure 1E. (E) Half-times of FRAP recovery for the indicated R-MCD net-charge variant labeled speckles. (F) Quantification of nucleolar enrichment for the indicated net-charge variants, as in Figure 5F. (G) In vitro condensation assays of the indicated R-MCD net-charge variants. Proteins were diluted to 10 μM at the indicated salt concentration and condensation was quantified by centrifugation as in Figure 1B. The left panels show SDS-PAGE analysis of a representative experiment. The graph to the right shows quantification from three independent experiments. (H) Speckle enrichment of mCherry-SRSF1 upon co-expression of the indicated R-MCD charge variants. Quantification as in Figure 1E. (I) Half-times of FRAP recovery for mCherry-SRSF1 labeled speckles on co-expression of the indicated R-MCD. For all quantification, data points are shown with mean and standard deviation. **p < 0.001, ***p < 0.0001. See also Figures S6 and S7.
Figure 7.. Increasing Speckle Cohesion Leads to Retention of Polyadenylated mRNAs in the Nucleus
(A) Images of cells expressing mGFP alone or the indicated R-MCD charge variant fused to mGFP. A field of cells is shown to allow comparison between transformed and untransformed cells. Upper panels show mGFP fluorescence. Lower panes reveal polyadenylated mRNA through Cy5-Oligo-dT30 staining. Dashed white lines identify the periphery of transformed cells. Scale bar: 20 μm. (B) Quantification of average density of nuclear polyadenylated mRNA upon expression of the indicated mGFP-fusion. For each transformation, transformed (+) and untransformed (−) cells are compared. Data points are shown with mean and standard deviation. **p < 0.001, ***p < 0.0001. (C) Quantification of the average density of nuclear to cytosolic mRNA upon expression of the indicated R-MCDs. The ratio is shown as a function of the level of R-MCD-mGFP fusion protein expression (x axis). Values derived from expression of mGFP alone and the net-neutral R-MCD are shown for comparison.
Similar articles
- Nuclear speckle integrity and function require TAO2 kinase.
Gao S, Esparza M, Dehghan I, Aksenova V, Zhang K, Batten K, Ferretti MB, Begg BE, Cagatay T, Shay JW, García-Sastre A, Goldsmith EJ, Chen ZJ, Dasso M, Lynch KW, Cobb MH, Fontoura BMA. Gao S, et al. Proc Natl Acad Sci U S A. 2022 Jun 21;119(25):e2206046119. doi: 10.1073/pnas.2206046119. Epub 2022 Jun 15. Proc Natl Acad Sci U S A. 2022. PMID: 35704758 Free PMC article. - The Patterning and Proportion of Charged Residues in the Arginine-Rich Mixed-Charge Domain Determine the Membrane-Less Organelle Targeted by the Protein.
Miyagi T, Yamazaki R, Ueda K, Narumi S, Hayamizu Y, Uji-I H, Kuroda M, Kanekura K. Miyagi T, et al. Int J Mol Sci. 2022 Jul 11;23(14):7658. doi: 10.3390/ijms23147658. Int J Mol Sci. 2022. PMID: 35887012 Free PMC article. - Identifying sequence perturbations to an intrinsically disordered protein that determine its phase-separation behavior.
Schuster BS, Dignon GL, Tang WS, Kelley FM, Ranganath AK, Jahnke CN, Simpkins AG, Regy RM, Hammer DA, Good MC, Mittal J. Schuster BS, et al. Proc Natl Acad Sci U S A. 2020 May 26;117(21):11421-11431. doi: 10.1073/pnas.2000223117. Epub 2020 May 11. Proc Natl Acad Sci U S A. 2020. PMID: 32393642 Free PMC article. - Liquid-liquid phase separation: Galectin-3 in nuclear speckles and ribonucleoprotein complexes.
Voss PG, Wang JL. Voss PG, et al. Exp Cell Res. 2023 Jun 1;427(1):113571. doi: 10.1016/j.yexcr.2023.113571. Epub 2023 Mar 31. Exp Cell Res. 2023. PMID: 37003559 Free PMC article. Review. - Splicing at the phase-separated nuclear speckle interface: a model.
Liao SE, Regev O. Liao SE, et al. Nucleic Acids Res. 2021 Jan 25;49(2):636-645. doi: 10.1093/nar/gkaa1209. Nucleic Acids Res. 2021. PMID: 33337476 Free PMC article. Review.
Cited by
- Pharmacologic hyperstabilisation of the HIV-1 capsid lattice induces capsid failure.
Faysal KMR, Walsh JC, Renner N, Márquez CL, Shah VB, Tuckwell AJ, Christie MP, Parker MW, Turville SG, Towers GJ, James LC, Jacques DA, Böcking T. Faysal KMR, et al. Elife. 2024 Feb 13;13:e83605. doi: 10.7554/eLife.83605. Elife. 2024. PMID: 38347802 Free PMC article. - Poison cassette exon splicing of SRSF6 regulates nuclear speckle dispersal and the response to hypoxia.
de Oliveira Freitas Machado C, Schafranek M, Brüggemann M, Hernández Cañás MC, Keller M, Di Liddo A, Brezski A, Blümel N, Arnold B, Bremm A, Wittig I, Jaé N, McNicoll F, Dimmeler S, Zarnack K, Müller-McNicoll M. de Oliveira Freitas Machado C, et al. Nucleic Acids Res. 2023 Jan 25;51(2):870-890. doi: 10.1093/nar/gkac1225. Nucleic Acids Res. 2023. PMID: 36620874 Free PMC article. - Nuclear speckleopathies: developmental disorders caused by variants in genes encoding nuclear speckle proteins.
Regan-Fendt KE, Izumi K. Regan-Fendt KE, et al. Hum Genet. 2024 Apr;143(4):529-544. doi: 10.1007/s00439-023-02540-6. Epub 2023 Mar 16. Hum Genet. 2024. PMID: 36929417 Review. - Phase Transitions of Associative Biomacromolecules.
Pappu RV, Cohen SR, Dar F, Farag M, Kar M. Pappu RV, et al. Chem Rev. 2023 Jul 26;123(14):8945-8987. doi: 10.1021/acs.chemrev.2c00814. Epub 2023 Mar 7. Chem Rev. 2023. PMID: 36881934 Free PMC article. Review. - IFF: Identifying key residues in intrinsically disordered regions of proteins using machine learning.
Ho WL, Huang HC, Huang JR. Ho WL, et al. Protein Sci. 2023 Sep;32(9):e4739. doi: 10.1002/pro.4739. Protein Sci. 2023. PMID: 37498545 Free PMC article.
References
- Alvarez M, Estivill X, and de la Luna S (2003). DYRK1A accumulates in splicing speckles through a novel targeting signal and induces speckle disassembly. J. Cell Sci 116, 3099–3107. - PubMed
Publication types
MeSH terms
Substances
LinkOut - more resources
Full Text Sources

