Titanium Dioxide Nanotube Arrays for Cardiovascular Stent Applications - PubMed (original) (raw)
Titanium Dioxide Nanotube Arrays for Cardiovascular Stent Applications
Ita Junkar et al. ACS Omega. 2020.
Abstract
Efficient stent implantation among others depends on avoiding the aggregation of platelets in the blood vessels and appropriate proliferation of endothelial cells and controlled proliferation of smooth muscle cells, which reduces the development of pathology, such as neointimal hyperplasia, thrombosis, and restenosis. The current article provides an elegant solution for prevention of platelet and smooth muscle cell adhesion and activation on stent surfaces while obtaining surface conditions to support the growth of human coronary artery endothelial cells. This was achieved by surface nanostructuring and chemical activation of the surface. Specific nanotopographies of titanium were obtained by electrochemical anodization, while appropriate chemical properties were attained by treatment of titanium oxide nanotubes by highly reactive oxygen plasma. Surface properties were studied by scanning electron microscopy, atomic force microscopy, and X-ray photoelectron spectroscopy. Wettability was evaluated by measuring the water contact angle. The influence of nanostructured morphology and plasma modification on in vitro biological response with human coronary artery endothelia and smooth muscle cells as well as whole blood was studied. Our results show that a combination of nanostructuring and plasma modification of the surfaces is an effective way to achieve desired biological responses necessary for implantable materials such as stents.
Copyright © 2020 American Chemical Society.
Conflict of interest statement
The authors declare no competing financial interest.
Figures
Figure 1
SEM images of the top surface of Ti foil and TiO2 nanostructures of different diameters: nanotubes with 15 nm (NT15), 50 nm (NT50), and 100 nm (NT100) in diameter; Scale bars: 500 nm.
Figure 2
AFM images of pristine Ti foil and TiO2 nanostructures with different diameters: (a) Ti foil, (b) nanotubes with 15 nm (NT15), (c) 50 nm (NT50), and (d) 100 nm (NT100) in diameter.
Figure 3
Chemical composition of plain titanium foil (Ti foil) and nanotubes (NTs), which were analyzed by XPS immediately after fabrication (Fresh NT), 1 month after fabrication (Old NT), and after plasma treatment (NT+P).
Figure 4
Comparison of XPS survey spectra on fresh nanotubes with 15, 50, and 100 nm in diameter (Fresh NT15, Fresh NT50, and Fresh NT100).
Figure 5
High-resolution (a) C 1s, (b) O 1s, and (c) Ti 2p peaks for fresh nanotubes with 100 nm in diameter (Fresh NT100) and plasma-treated nanotubes with 100 nm in diameter (NT100+P).
Figure 6
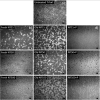
SEM images of (a) Ti foil, (b) fresh, (c) 2 months old, and (d) plasma-treated NT15, NT50, and NT100 interacting with platelets (NT: nanotubes with 15, 50, and 100 nm in diameter). Scale bars: 10 μm.
Figure 7
SEM images of Ti foil, fresh NT50, 1 month old NT50, and plasma-treated NT50 samples interacting with platelets (NT: nanotubes with 15, 50, and 100 nm in diameter). Ti foil: platelets numerous and fully spread, very high adhesion; Fresh NT50: platelets mainly in dendritic form, medium adhesion; Old NT50: platelets fully spread, high adhesion; NT50+P: platelets rounded and dendritic, low adhesion. Scale bars: 1 μm.
Figure 8
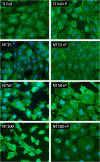
Fluorescence microscopy images of HCAEC grown on Ti foil, fresh NT15, fresh NT50, fresh NT100, plasma-treated NT15, plasma-treated NT50, and plasma-treated NT100 (NT: nanotubes with 15, 50, and 100 nm in diameter). Green is phalloidin-FITC staining, and blue is DAPI.
Figure 9
Fluorescence microscopy images of HCAEC grown on Ti foil, fresh NT15, and plasma-treated NT15 (NT: nanotubes with 15, 50, and 100 nm in diameter) for 2 days in the presence of SAA in medium in the last 24 h. Tests were conducted with acute-phase protein serum amyloid A (SAA). Green is phalloidin-FITC staining, and blue is DAPI.
Figure 10
Fluorescence microscopy images of SMC grown on Ti foil, fresh NT15, and plasma-treated NT15 (NT: nanotubes with 15 nm in diameter) for 2 days.
Figure 11
Fluorescence microscopy images of SMC grown on Ti foil, fresh NT15, and plasma-treated NT15 (NT: nanotubes with 15 nm in diameter) for 2 days. Tests were conducted with serum amyloid A (SAA 500 nM) addition in the cell culture media.
Similar articles
- Improved in vitro angiogenic behavior on anodized titanium dioxide nanotubes.
Beltrán-Partida E, Valdéz-Salas B, Moreno-Ulloa A, Escamilla A, Curiel MA, Rosales-Ibáñez R, Villarreal F, Bastidas DM, Bastidas JM. Beltrán-Partida E, et al. J Nanobiotechnology. 2017 Jan 31;15(1):10. doi: 10.1186/s12951-017-0247-8. J Nanobiotechnology. 2017. PMID: 28143540 Free PMC article. - Binding of human coronary artery endothelial cells to plasma-treated titanium dioxide nanotubes of different diameters.
Flašker A, Kulkarni M, Mrak-Poljšak K, Junkar I, Čučnik S, Žigon P, Mazare A, Schmuki P, Iglič A, Sodin-Semrl S. Flašker A, et al. J Biomed Mater Res A. 2016 May;104(5):1113-20. doi: 10.1002/jbm.a.35646. Epub 2016 Jan 30. J Biomed Mater Res A. 2016. PMID: 26748552 - In vitro biological responses of plasma nanocoatings for coronary stent applications.
Phan T, Jones JE, Chen M, Strawn TL, Khoukaz HB, Ji Y, Kumar A, Bowles DK, Fay WP, Yu Q. Phan T, et al. J Biomed Mater Res A. 2023 Nov;111(11):1768-1780. doi: 10.1002/jbm.a.37587. Epub 2023 Jul 19. J Biomed Mater Res A. 2023. PMID: 37465994 Free PMC article. - Fine-Tuning the Nanostructured Titanium Oxide Surface for Selective Biological Response.
Rawat N, Benčina M, Paul D, Kovač J, Lakota K, Žigon P, Kralj-Iglič V, Ho HC, Vukomanović M, Iglič A, Junkar I. Rawat N, et al. ACS Appl Bio Mater. 2023 Dec 18;6(12):5481-5492. doi: 10.1021/acsabm.3c00686. Epub 2023 Dec 7. ACS Appl Bio Mater. 2023. PMID: 38062750 Free PMC article. - Bio-Performance of Hydrothermally and Plasma-Treated Titanium: The New Generation of Vascular Stents.
Benčina M, Rawat N, Lakota K, Sodin-Šemrl S, Iglič A, Junkar I. Benčina M, et al. Int J Mol Sci. 2021 Nov 1;22(21):11858. doi: 10.3390/ijms222111858. Int J Mol Sci. 2021. PMID: 34769289 Free PMC article.
Cited by
- Unravelling Surface Modification Strategies for Preventing Medical Device-Induced Thrombosis.
Luu CH, Nguyen NT, Ta HT. Luu CH, et al. Adv Healthc Mater. 2024 Jan;13(1):e2301039. doi: 10.1002/adhm.202301039. Epub 2023 Oct 5. Adv Healthc Mater. 2024. PMID: 37725037 Free PMC article. Review. - Nanomaterials for small diameter vascular grafts: overview and outlook.
Wang N, Wang H, Weng D, Wang Y, Yu L, Wang F, Zhang T, Liu J, He Z. Wang N, et al. Nanoscale Adv. 2023 Nov 6;5(24):6751-6767. doi: 10.1039/d3na00666b. eCollection 2023 Dec 5. Nanoscale Adv. 2023. PMID: 38059025 Free PMC article. Review. - Classification and application of metal-based nanoantioxidants in medicine and healthcare.
Nam NN, Tran NKS, Nguyen TT, Trai NN, Thuy NP, Do HDK, Tran NHT, Trinh KTL. Nam NN, et al. Beilstein J Nanotechnol. 2024 Apr 12;15:396-415. doi: 10.3762/bjnano.15.36. eCollection 2024. Beilstein J Nanotechnol. 2024. PMID: 38633767 Free PMC article. Review. - Advanced Antimicrobial and Anti-Infective Strategies to Manage Peri-Implant Infection: A Narrative Review.
Li Y, Stewart CA, Finer Y. Li Y, et al. Dent J (Basel). 2024 May 6;12(5):125. doi: 10.3390/dj12050125. Dent J (Basel). 2024. PMID: 38786523 Free PMC article. Review. - Strategies for improving antimicrobial properties of stainless steel.
Resnik M, Benčina M, Levičnik E, Rawat N, Iglič A, Junkar I. Resnik M, et al. Materials (Basel). 2020 Jun 30;13(13):2944. doi: 10.3390/ma13132944. Materials (Basel). 2020. PMID: 32630130 Free PMC article. Review.
References
- Dangas G. D.; Schoos M. M.; Steg P. G.; Mehran R.; Clemmensen P.; van’t Hof A.; Prats J.; Bernstein D.; Deliargyris E. N.; Stone G. W. Early Stent Thrombosis and Mortality After Primary Percutaneous Coronary Intervention in ST-Segment-Elevation Myocardial Infarction A Patient-Level Analysis of 2 Randomized Trials. Circ.: Cardiovasc. Interventions 2016, 9, 15.10.1161/CIRCINTERVENTIONS.115.003272. - DOI - PubMed
- Costa R. A.; Sousa J. E.; Abizaid A.; Chaves A.; Feres F.; Sousa A. G. M. R.; Musumeci G.; Mehran R.; Fitzgerald P. J.; Lansky A. J.; Leon M. B.; Shiran A.; Halon D. A.; Lewis B. S.; Guagliumi G. The randomised study of the double dose versus single dose sirolimus-eluting stent for the treatment of diabetic patients with de novo coronary lesions. EuroIntervention : J. EuroPCR Collab. Work. Group Interventional Cardiol. Eur. Soc. Cardiol. 2006, 2, 295–301. - PubMed
LinkOut - more resources
Full Text Sources
Other Literature Sources


