Marine heatwaves exacerbate climate change impacts for fisheries in the northeast Pacific - PubMed (original) (raw)
Marine heatwaves exacerbate climate change impacts for fisheries in the northeast Pacific
William W L Cheung et al. Sci Rep. 2020.
Abstract
Marine heatwaves (MHWs) have occurred in all ocean basins with severe negative impacts on coastal and ocean ecosystems. The northeast Pacific 2013-2015 MHW in particular received major societal concerns. Yet, our knowledge about how MHWs impact fish stocks is limited. Here, we combine outputs from a large ensemble simulation of an Earth system model with a fish impact model to simulate responses of major northeast Pacific fish stocks to MHWs. We show that MHWs cause biomass decrease and shifts in biogeography of fish stocks that are at least four times faster and bigger in magnitude than the effects of decadal-scale mean changes throughout the 21st century. With MHWs, we project a doubling of impact levels by 2050 amongst the most important fisheries species over previous assessments that focus only on long-term climate change. Our results underscore the additional challenges from MHWs for fisheries and their management under climate change.
Conflict of interest statement
The authors declare no competing interests.
Figures
Figure 1
Average annual fisheries catches of the 22 studied fish stocks from 1981 to 2015 in the northeast Pacific Ocean and the three large marine ecosystems therein. Catches data were obtained from the Sea Around Us fisheries database (
). The boundary of the northeast Pacific Ocean is based on the United Nations’ Food and Agriculture Organization Statistical Area 67. The large marine ecosystems include: EBS - Eastern Bering Sea, GoA - Gulf of Alaska, and CC - California Current.
Figure 2
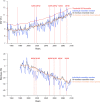
Schematic diagram explaining the characterization of Marine Heatwaves (MHWs) and their impacts on fish stocks. (a) The characterization of MHWs based on outputs from the 10 ensemble member projections of the GFDL ESM2M and (b) their impacts on biomass of the sockeye salmon (Oncorhynchus nerka) in the Gulf of Alaska large marine ecosystem. The red vertical bars in both panels indicate MHW events. Biomass changes are given as changes relative to 1986 to 2005.
Figure 3
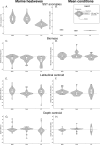
Projected changes in sea surface temperature (A,B) and the impact indicators (biomass, latitudinal centroid and depth centroid; C–H) of the 22 studied fish stocks in the three large marine ecosystems (Eastern Bering Sea - EBS, Gulf of Alaska - GoA, California Current - CC) of the northeast Pacific during MHWs (left panels) and due to long-term climate change from 1981 to 2100 (right panels). Changes in sea surface temperature and impact indicators during MHWs were expressed relative to the spline-smoothed ensemble-mean of the same time period. In contrast, long-term climate changes were calculated from linear regressions over the 1981–2100 period, with the rate of change (slope of the regression) expressed as change per decade. Negative depth centroid shifts in G-H indicate species’ average distribution that were projected to be deeper.
Figure 4
Projected mean changes in biomass, latitudinal and depth centroid of the 22 exploited marine fish stocks in the Eastern Bering Sea (EBS), Gulf of Alaska (GoA) and California Current (CC) during MHW years. NA - not available in catch record between 2006 and 2015.The different colour scales represent the projected changes in biomass, latitudinal centroid and depth centroid. Stripping of a cell represents changes at a significant level of below 0.05.
Figure 5
Projected time-series of changes in sea surface temperature (SST) (A–C), biomass (D–F) and latitudinal centroid (G–I): Pacific cod (Gadus macrocephalus) (D,G), sockeye salmon (Oncorhynchus nerka) (E,H) and Californian anchovy (Engraulis mordax) (F,I)) in the Eastern Bering Sea (EBS), Gulf of Alaska (GoA) and California Current (CC). The solid lines represent the average values across the 10 ensemble member simulations (smoothed with a cubic spline function); blue-colored triangles represent values during MHW years; the different intensity of blue color represents different ensemble member simulations (see Figs. S1–12 for results for all the large marine ecosystems and studied fish stocks).
Similar articles
- Responses of ichthyoplankton assemblages to the recent marine heatwave and previous climate fluctuations in several Northeast Pacific marine ecosystems.
Nielsen JM, Rogers LA, Brodeur RD, Thompson AR, Auth TD, Deary AL, Duffy-Anderson JT, Galbraith M, Koslow JA, Perry RI. Nielsen JM, et al. Glob Chang Biol. 2021 Feb;27(3):506-520. doi: 10.1111/gcb.15415. Epub 2020 Dec 12. Glob Chang Biol. 2021. PMID: 33107157 - Large potential impacts of marine heatwaves on ecosystem functioning.
Guibourd de Luzinais V, Gascuel D, Reygondeau G, Cheung WWL. Guibourd de Luzinais V, et al. Glob Chang Biol. 2024 Jul;30(7):e17437. doi: 10.1111/gcb.17437. Glob Chang Biol. 2024. PMID: 39054881 - Marine heatwaves under global warming.
Frölicher TL, Fischer EM, Gruber N. Frölicher TL, et al. Nature. 2018 Aug;560(7718):360-364. doi: 10.1038/s41586-018-0383-9. Epub 2018 Aug 15. Nature. 2018. PMID: 30111788 - Impacts of marine heatwaves in coastal ecosystems depend on local environmental conditions.
Starko S, van der Mheen M, Pessarrodona A, Wood GV, Filbee-Dexter K, Neufeld CJ, Montie S, Coleman MA, Wernberg T. Starko S, et al. Glob Chang Biol. 2024 Aug;30(8):e17469. doi: 10.1111/gcb.17469. Glob Chang Biol. 2024. PMID: 39155748 Review. - Biological Impacts of Marine Heatwaves.
Smith KE, Burrows MT, Hobday AJ, King NG, Moore PJ, Sen Gupta A, Thomsen MS, Wernberg T, Smale DA. Smith KE, et al. Ann Rev Mar Sci. 2023 Jan 16;15:119-145. doi: 10.1146/annurev-marine-032122-121437. Epub 2022 Aug 17. Ann Rev Mar Sci. 2023. PMID: 35977411 Review.
Cited by
- Role of Sea Surface Physical Processes in Mixed-Layer Temperature Changes During Summer Marine Heat Waves in the Chile-Peru Current System.
Cooley KM, Fewings MR, Lerczak JA, O'Neill LW, Brown KS. Cooley KM, et al. J Geophys Res Oceans. 2022 Jul;127(7):e2021JC018338. doi: 10.1029/2021JC018338. Epub 2022 Jul 15. J Geophys Res Oceans. 2022. PMID: 36245950 Free PMC article. - Marine heatwaves are not a dominant driver of change in demersal fishes.
Fredston AL, Cheung WWL, Frölicher TL, Kitchel ZJ, Maureaud AA, Thorson JT, Auber A, Mérigot B, Palacios-Abrantes J, Palomares MLD, Pecuchet L, Shackell NL, Pinsky ML. Fredston AL, et al. Nature. 2023 Sep;621(7978):324-329. doi: 10.1038/s41586-023-06449-y. Epub 2023 Aug 30. Nature. 2023. PMID: 37648851 - Climate change adaptation through an integrative lens in Aotearoa New Zealand.
Lawrence J, Wreford A, Blackett P, Hall D, Woodward A, Awatere S, Livingston ME, Macinnis-Ng C, Walker S, Fountain J, Costello MJ, Ausseil AE, Watt MS, Dean SM, Cradock-Henry NA, Zammit C, Milfont TL. Lawrence J, et al. J R Soc N Z. 2023 Aug 17;54(4):491-522. doi: 10.1080/03036758.2023.2236033. eCollection 2024. J R Soc N Z. 2023. PMID: 39440121 Free PMC article. Review. - An 80-million-year sulphur isotope record of pyrite burial over the Permian-Triassic.
Salisbury J, Gröcke DR, Cheung HDRA, Kump LR, McKie T, Ruffell A. Salisbury J, et al. Sci Rep. 2022 Oct 17;12(1):17370. doi: 10.1038/s41598-022-21542-4. Sci Rep. 2022. PMID: 36253491 Free PMC article. - Successive extreme climatic events lead to immediate, large-scale, and diverse responses from fish in the Arctic.
Husson B, Lind S, Fossheim M, Kato-Solvang H, Skern-Mauritzen M, Pécuchet L, Ingvaldsen RB, Dolgov AV, Primicerio R. Husson B, et al. Glob Chang Biol. 2022 Jun;28(11):3728-3744. doi: 10.1111/gcb.16153. Epub 2022 Apr 7. Glob Chang Biol. 2022. PMID: 35253321 Free PMC article.
References
- Smale DA, Wernberg T, Vanderklift MA. Regional-scale variability in the response of benthic macroinvertebrate assemblages to a marine heatwave. Mar. Ecol. Prog. Ser. 2017;568:17–30. doi: 10.3354/meps12080. - DOI
- Wernberg T, et al. An extreme climatic event alters marine ecosystem structure in a global biodiversity hotspot. Nat. Clim. Chang. 2013;3:78. doi: 10.1038/nclimate1627. - DOI
- Collins, M. et al. Extremes, Abrupt Changes and Managing Risks. (2019).
Publication types
LinkOut - more resources
Full Text Sources


