Functional cycle of EEA1-positive early endosome: Direct evidence for pre-existing compartment of degradative pathway - PubMed (original) (raw)
Functional cycle of EEA1-positive early endosome: Direct evidence for pre-existing compartment of degradative pathway
Rimma Kamentseva et al. PLoS One. 2020.
Abstract
Early endosomes, regarded as the main sorting station on endocytic pathway, are characterized by high frequency of homotypic fusions mediated by tethering protein EEA1. Despite intensive investigations, biogenesis of endosomes, boundaries between early and late endosomes, and process of cargo transition though them remain obscure. Here, using EGF/EGFR endocytosis as a model and confocal microscopy of fixed and live cells, we provide evidence favoring EEA1-vesicles being pre-existed vesicular compartment, that maintains its resident proteins' level and is sensitive to biosynthetic, but not endocytic pathway disturbance. EEA1-vesicles directly fuse with incoming EGF/EGFR-vesicles into hybrid endosomes with separated EEA1- and EGFR-domains, thus providing a platform for rapid achievement of an excess of surface-derived membrane that is used to form intraluminal vesicles (ILVs). Thus, multivesicular structures colocalized with EEA1 are still early endosomes. "EEA1-cycle" ends by exclusion of EGFR-containing domains with ILVs inside that turns into MVE and restoration of initial EEA1-vesicles population.
Conflict of interest statement
The authors have declared that no competing interests exist.
Figures
Fig 1. EEA1 is localized onto membrane vesicles independently on growth conditions.
Hela cells were incubated in serum-free (A, B) or 10% FBS-containing (C) medium for 12h. (B) Cells were treated with 20μM nocodazole for 30 min before fixation. Then cells were stained using antibodies against EEA1 (green) and EGFR (red) (upper and middle row), or α-tubulin (lower row). Nuclei were visualized using Hoechst 33342 (blue). To visualize total population of EEA1-vesicles (upper row) and microtubules (lower row) the maximum intensity projections are presented. Single optical slices (middle row) are given to avoid possible artificial superposition of vesicles along Z axis. Scale bar—10 μm.
Fig 2. The amount of EEA1 detected in membrane fraction does not change after stimulation of EGF receptor endocytosis.
EGF was allowed to bind to the membrane of HeLa cells at +4°C for 40 min and then EGFR endocytosis was stimulated by transfer to +37°C for the time indicated. (A) The membrane fraction was isolated using ultracentrifugation. Levels of EEA1 and GAPDH in cell membrane fractions and in total cell lysate were detected by immunoblotting. The total protein quantity was assessed by Ponceau S staining and used as a loading control. (B) The EEA1 density was quantified in 3 independent experiments, normalized by Ponceau S staining and the quantity relative to control calculated for each time point. Non-parametric one sample sign test with Bonferroni-Holm correction for multiple comparisons showed no significant difference from control in all time points (corrected p-values are 1, 0.75 and 1 for 15, 30 and 60 min, correspondingly).
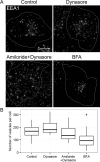
Fig 3. The effect of endocytosis inhibition and golgi disturbance on EEA1-positive vesicles.
Hela cells were incubated for 6 hours with 10 μg/ml brefeldin A (BFA) to disrupt biosynthetic pathway, or 80 μM dynasore alone or in combination with 66 μM 5-(N, N-hexamethylene) amiloride to block endocytosis. Then cells were fixed and immunostained with anti-EEA1 antibodies. (A) The maximum intensity projections of typical cell are presented. Scale bar—10 μm. (B) The number of EEA1-vesicles was quantified in 15–20 cells per condition. The data are presented as boxplot that shows median, 25% and 75% quartiles, minimum and maximum value. The star indicates p<0.05.
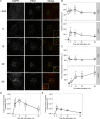
Fig 4. The dynamics of EEA1- and EGFR-positive vesicles colocalization in HeLa cells following the stimulation of EGF/EGFR-complexes endocytosis.
Endocytosis in serum-deprived Hela cells was stimulated according to pulse-chase protocol by adding of EGF for 5 min followed by washout of unbound ligand and chase period at 37°C. Cells not treated with ligand (- EGF) and cells chased for the indicated period were fixed and immunostained using antibodies against EEA1 (green channel) and EGFR (red channel). (A) Maximum intensity projections of the typical cells are presented. Scale bar—10 μm (3 μm in the enlarged insets). The number (B), mean integral density of vesicles (C) and object-based colocalization of the cells from the same experiment (D, E) were quantified. For each time point 15–20 cells were taken into analysis. The data are presented as boxplot that shows median, 25% and 75% quartiles, minimum and maximum value. In B,C the star indicates significant difference from unstimulated cells (p<0.05).
Fig 5. Live imaging of EEA1-vesicles population in serum-starved, non-stimulated Hela cells.
The time-lapses present the fusion (A) and fission (B) events in serum-starved HeLa cells transiently expressing EEA1-GFP. The time after start of imaging is indicated at the frames. Scale bars– 10 μm (whole cell) or 3 μm (ROI time-lapse). Arrowheads indicate vesicles of interest, circle (A)–the moment of fusion. Full movies are presented as S1 and S2 Movies, respectively.
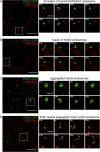
Fig 6. The EEA1-cycle in living HeLa cells expressing EEA1-GFP.
EGFR endocytosis was stimulated by EGF-Cy3 (red channel) in HeLa cells transiently expressing EEA1-GFP (green channel) according to the pre-binding protocol (described in the Material and methods section) to synchronize endocytic events. Time-lapse imaging at +37°C was performed. The following stages of the cycle are presented: (A) formation of hybrid EGF/EEA1-endosome (5–10 min), (B) fusion of hybrid endosomes (5–15 min), (C) aggregated hybrid endosomes (15–40 min), (D) EGF-vesicle segregation from hybrid endosome (25–60 min). Scale bars– 10 μm (whole cell) or 3 μm (ROI time-lapse). Arrowheads indicate vesicles of interest. Full movies are presented as S3, S4, S6 and S8 Movies, respectively.
Fig 7. Localization of EEA1 protein on endosomes of PAE A11 cells expressing EGFR-GFP during endocytosis of EGFR.
(A) EGFR endocytosis was stimulated in serum-deprived PAE A11 cells expressing EGFR-GFP (green channel) according to pulse-chase protocol by adding of EGF for 5 min followed by washout of unbound ligand and chase period at 37°C. Cells not treated with ligand (- EGF) and cells chased for the indicated period were fixed and immunostained using antibodies against EEA1 (red channel). Maximum intensity projection of the typical cells (upper row, scale bar—10 μm) and maximum intensity projection of 5 optical slices for the enlarged region (lower row, scale bar—3 μm) of typical cell are presented. Arrows indicates the sites of tethering between two vesicles, enriched with EEA1; arrowheads show the examples of vesicles with multiple EEA1-positive domains. (B) EGFR endocytosis was stimulated according to pulse-chase protocol by adding of EGF-QD655 for 5 min followed by washing out the unbound ligand and time-lapse imaging at +37°C started in 24 min after endocytosis stimulation. The chosen frames are shown and the time after start of imaging is indicated at the frames. Scale bars– 10 (whole cell) and 3 (ROI time-lapse) μm. Full movie is presented as S7 Movie.
Similar articles
- [Analysis of vesicle subpopulations carrying early endosomal autoantigen EEA1].
Zlobina MV, Kamentseva RS, Kornilova ES, Kharchenko MV. Zlobina MV, et al. Tsitologiia. 2014;56(10):741-8. Tsitologiia. 2014. PMID: 25711083 Russian. - Mammalian CORVET is required for fusion and conversion of distinct early endosome subpopulations.
Perini ED, Schaefer R, Stöter M, Kalaidzidis Y, Zerial M. Perini ED, et al. Traffic. 2014 Dec;15(12):1366-89. doi: 10.1111/tra.12232. Epub 2014 Nov 6. Traffic. 2014. PMID: 25266290 - The enigmatic endosome - sorting the ins and outs of endocytic trafficking.
Naslavsky N, Caplan S. Naslavsky N, et al. J Cell Sci. 2018 Jul 6;131(13):jcs216499. doi: 10.1242/jcs.216499. J Cell Sci. 2018. PMID: 29980602 Free PMC article. Review. - Endosome maturation, transport and functions.
Scott CC, Vacca F, Gruenberg J. Scott CC, et al. Semin Cell Dev Biol. 2014 Jul;31:2-10. doi: 10.1016/j.semcdb.2014.03.034. Epub 2014 Apr 4. Semin Cell Dev Biol. 2014. PMID: 24709024 Review.
Cited by
- Spatial snapshots of amyloid precursor protein intramembrane processing via early endosome proteomics.
Park H, Hundley FV, Yu Q, Overmyer KA, Brademan DR, Serrano L, Paulo JA, Paoli JC, Swarup S, Coon JJ, Gygi SP, Wade Harper J. Park H, et al. Nat Commun. 2022 Oct 16;13(1):6112. doi: 10.1038/s41467-022-33881-x. Nat Commun. 2022. PMID: 36245040 Free PMC article. - EGF, TGF-α and Amphiregulin Differently Regulate Endometrium-Derived Mesenchymal Stromal/Stem Cells.
Kamentseva RS, Kharchenko MV, Gabdrahmanova GV, Kotov MA, Kosheverova VV, Kornilova ES. Kamentseva RS, et al. Int J Mol Sci. 2023 Aug 29;24(17):13408. doi: 10.3390/ijms241713408. Int J Mol Sci. 2023. PMID: 37686213 Free PMC article. - The intracellular visualization of exogenous DNA in fluorescence microscopy.
Greitens C, Leroux JC, Burger M. Greitens C, et al. Drug Deliv Transl Res. 2024 Aug;14(8):2242-2261. doi: 10.1007/s13346-024-01563-4. Epub 2024 Mar 25. Drug Deliv Transl Res. 2024. PMID: 38526634 Free PMC article. Review. - Divergent regulation of α-arrestin ARRDC3 function by ubiquitination.
Wedegaertner H, Bosompra O, Kufareva I, Trejo J. Wedegaertner H, et al. Mol Biol Cell. 2023 Aug 1;34(9):ar93. doi: 10.1091/mbc.E23-02-0055. Epub 2023 May 24. Mol Biol Cell. 2023. PMID: 37223976 Free PMC article. - Microenvironmental Impact on InP/ZnS-Based Quantum Dots in In Vitro Models and in Living Cells: Spectrally- and Time-Resolved Luminescence Analysis.
Litvinov I, Salova A, Aksenov N, Kornilova E, Belyaeva T. Litvinov I, et al. Int J Mol Sci. 2023 Jan 31;24(3):2699. doi: 10.3390/ijms24032699. Int J Mol Sci. 2023. PMID: 36769021 Free PMC article.
References
- Griffiths G. On vesicles and membrane compartments. Protoplasma. 1996;195: 37–58. 10.1007/BF01279185 - DOI
- The Nobel Prize in Physiology or Medicine 2013 [Internet]. [cited 1 Aug 2019]. Available: https://www.nobelprize.org/prizes/medicine/2013/summary/
- Tjelle TE, Brech A, Juvet LK, Griffiths G, Berg T. Isolation and characterization of early endosomes, late endosomes and terminal lysosomes: their role in protein degradation. J Cell Sci. 1996;109: 2905 LP– 2914. Available: http://jcs.biologists.org/content/109/12/2905.abstract - PubMed
Publication types
MeSH terms
Substances
LinkOut - more resources
Full Text Sources
Molecular Biology Databases
Research Materials
Miscellaneous


