Anti-vimentin, anti-TUFM, anti-NAP1L1 and anti-DPYSL2 nanobodies display cytotoxic effect and reduce glioblastoma cell migration - PubMed (original) (raw)
Anti-vimentin, anti-TUFM, anti-NAP1L1 and anti-DPYSL2 nanobodies display cytotoxic effect and reduce glioblastoma cell migration
Alja Zottel et al. Ther Adv Med Oncol. 2020.
Abstract
Background: Glioblastoma is a particularly common and very aggressive primary brain tumour. One of the main causes of therapy failure is the presence of glioblastoma stem cells that are resistant to chemotherapy and radiotherapy, and that have the potential to form new tumours. This study focuses on validation of eight novel antigens, TRIM28, nucleolin, vimentin, nucleosome assembly protein 1-like 1 (NAP1L1), mitochondrial translation elongation factor (EF-TU) (TUFM), dihydropyrimidinase-related protein 2 (DPYSL2), collapsin response mediator protein 1 (CRMP1) and Aly/REF export factor (ALYREF), as putative glioblastoma targets, using nanobodies.
Methods: Expression of these eight antigens was analysed at the cellular level by qPCR, ELISA and immunocytochemistry, and in tissues by immunohistochemistry. The cytotoxic effects of the nanobodies were determined using AlamarBlue and water-soluble tetrazolium tests. Annexin V/propidium iodide tests were used to determine apoptotsis/necrosis of the cells in the presence of the nanobodies. Cell migration assays were performed to determine the effects of the nanobodies on cell migration.
Results: NAP1L1 and CRMP1 were significantly overexpressed in glioblastoma stem cells in comparison with astrocytes and glioblastoma cell lines at the mRNA and protein levels. Vimentin, DPYSL2 and ALYREF were overexpressed in glioblastoma cell lines only at the protein level. The functional part of the study examined the cytotoxic effects of the nanobodies on glioblastoma cell lines. Four of the nanobodies were selected in terms of their specificity towards glioblastoma cells and protein overexpression: anti-vimentin (Nb79), anti-NAP1L1 (Nb179), anti-TUFM (Nb225) and anti-DPYSL2 (Nb314). In further experiments to optimise the nanobody treatment schemes, to increase their effects, and to determine their impact on migration of glioblastoma cells, the anti-TUFM nanobody showed large cytotoxic effects on glioblastoma stem cells, while the anti-vimentin, anti-NAP1L1 and anti-DPYSL2 nanobodies were indicated as agents to target mature glioblastoma cells. The anti-vimentin nanobody also had significant effects on migration of mature glioblastoma cells.
Conclusion: Nb79 (anti-vimentin), Nb179 (anti-NAP1L1), Nb225 (anti-TUFM) and Nb314 (anti-DPYSL2) nanobodies are indicated for further examination for cell targeting. The anti-TUFM nanobody, Nb225, is particularly potent for inhibition of cell growth after long-term exposure of glioblastoma stem cells, with minor effects seen for astrocytes. The anti-vimentin nanobody represents an agent for inhibition of cell migration.
Keywords: DPYSL2; NAP1L1; TUFM; cell migration; cytotoxicity; glioblastoma; glioblastoma stem cells; nanobodies; vimentin.
© The Author(s), 2020.
Conflict of interest statement
Conflict of interest statement: The authors declare that there is no conflict of interest.
Figures
Figure 1.
Relative mRNA expression of the selected antigens (as indicated) in the U251MG and U87MG cells, the NCH co-cultures and the astrocytes. The reference genes were RPL13A and CYC1. Data show means ±SD for the relative expression of nine replicates. **p < 0.01, ***p < 0.001, ****p < 0.0001. Expression of CRMP1 in U87MG cells is not shown, the mRNA was below the detection limit.
Figure 2.
Protein expression of the selected antigens (as indicated) in the U251MG and U87MG cells, the NCH co-cultures and the astrocytes. Data show means ± SD from three replicates, with absorbance measured at 405 nm. *p < 0.05, **p < 0.01, ***p < 0.001, ****p < 0.0001.
Figure 3.
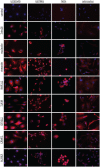
Representative immunocytochemical images of the selected antigens (as indicated) in the U251MG and U87MG cells, the NCH co-cultures and the astrocytes. The antigens were stained with a commercial antibody (CF640R fluorophore; red) and the nuclei with DAPI (blue). The control had no primary antibody included. Scale bar, 20μm (top left image; applicable to all images). DAPI, 4′,6-diamidino-2-phenylindole dihydrochloride.
Figure 4.
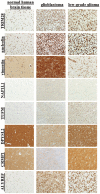
Representative immunohistochemical images for the selected proteins (as indicated) in normal brain, glioblastoma and low-grade glioma tissues.
Figure 5.
Effects of 50μM temozolomide on cell survival for the cell lines (as indicated). The AlamarBlue viability assay was used. Data are means of three samples with three replicates (n = 9). **** p < 0.0001.
Figure 6.
Effects of the selected nanobodies (as indicated; 10μg/mL, 100μg/mL) on cell survival of the cell lines (as indicated). Treatments were for 24h, 48 h and 72h. Data are means of three samples with three replicates (n = 9). *p < 0.05, **p < 0.01, ***p < 0.001, ****p < 0.0001.
Figure 7.
Effect of the concurrent nanobody treatments (as indicated) on cell survival of the cell lines (as indicated). Treatments were for 72h. Data are means±SD of three samples with three replicates (n = 9). *p < 0.05, **p < 0.01, ****p < 0.0001.
Figure 8.
Effects of consecutive 50μM temozolomide treatments (2 × 72h) on cell survival of the cell lines (as indicated). Data are means±SD of three samples with three replicates (n = 9). ****p < 0.0001.
Figure 9.
Effects of consecutive treatment with the selected nanobodies (as indicated; 2 × 72h) on cell survival of the cell lines (as indicated). Data are means±SD of three samples with three replicates (n = 9). *p < 0.05, **p < 0.01, *** p < 0.001, ****p < 0.0001.
Figure 10.
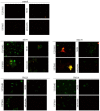
Representative images for apoptosis/necrosis assays of treatments with the selected nanobodies (as indicated; 100μg/mL, 24h) of the cell lines (as indicated). Annexin V (green) shows apoptotic cells; propidium iodide was used to show necrotic cells. Scale bar, 20μm (top left image; applicable to all images).
Figure 11.
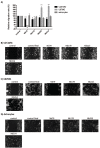
Quantification (A) and representative images (B–D) for the effects of treatments with the selected nanobodies (as indicated; 100 μg/mL) on the migration speed of the cell lines (as indicated). (A) Single samples were analysed from images captured for two or three different positions. Data are means ± SD of three measurements. *p < 0.05, **p < 0.01, ***p < 0.001, ****p < 0.0001. (B–D) Scale bar, 100 μm (top left image; applicable to all images). Nanobody treatments were 7 h for U251MG cells, 24 h for U87MG cells and 18 h for astrocytes. SD, standard deviation.
Similar articles
- Sonication is a suitable method for loading nanobody into glioblastoma small extracellular vesicles.
Colja S, Jovčevska I, Šamec N, Romih R, Zottel A. Colja S, et al. Heliyon. 2023 Apr 21;9(5):e15674. doi: 10.1016/j.heliyon.2023.e15674. eCollection 2023 May. Heliyon. 2023. PMID: 37131433 Free PMC article. - Glioblastoma-specific anti-TUFM nanobody for in-vitro immunoimaging and cancer stem cell targeting.
Samec N, Jovcevska I, Stojan J, Zottel A, Liovic M, Myers MP, Muyldermans S, Šribar J, Križaj I, Komel R. Samec N, et al. Oncotarget. 2018 Apr 3;9(25):17282-17299. doi: 10.18632/oncotarget.24629. eCollection 2018 Apr 3. Oncotarget. 2018. PMID: 29707108 Free PMC article. - Anti-Vimentin Nanobody Decreases Glioblastoma Cell Invasion In Vitro and In Vivo.
Zottel A, Novak M, Šamec N, Majc B, Colja S, Katrašnik M, Vittori M, Hrastar B, Rotter A, Porčnik A, Lah Turnšek T, Komel R, Breznik B, Jovčevska I. Zottel A, et al. Cancers (Basel). 2023 Jan 17;15(3):573. doi: 10.3390/cancers15030573. Cancers (Basel). 2023. PMID: 36765531 Free PMC article. - TUFM in health and disease: exploring its multifaceted roles.
Liu N, Pang B, Kang L, Li D, Jiang X, Zhou CM. Liu N, et al. Front Immunol. 2024 May 29;15:1424385. doi: 10.3389/fimmu.2024.1424385. eCollection 2024. Front Immunol. 2024. PMID: 38868764 Free PMC article. Review. - Nanobodies and Nanobody-Based Human Heavy Chain Antibodies As Antitumor Therapeutics.
Bannas P, Hambach J, Koch-Nolte F. Bannas P, et al. Front Immunol. 2017 Nov 22;8:1603. doi: 10.3389/fimmu.2017.01603. eCollection 2017. Front Immunol. 2017. PMID: 29213270 Free PMC article. Review.
Cited by
- Multi-omic analyses of m5C readers reveal their characteristics and immunotherapeutic proficiency.
Xu R, Wang Y, Kuang Y. Xu R, et al. Sci Rep. 2024 Jan 18;14(1):1651. doi: 10.1038/s41598-024-52110-7. Sci Rep. 2024. PMID: 38238581 Free PMC article. - Applications of nanobodies in brain diseases.
Zheng F, Pang Y, Li L, Pang Y, Zhang J, Wang X, Raes G. Zheng F, et al. Front Immunol. 2022 Nov 8;13:978513. doi: 10.3389/fimmu.2022.978513. eCollection 2022. Front Immunol. 2022. PMID: 36426363 Free PMC article. Review. - Proteomic Characterization of Two Extracellular Vesicle Subtypes Isolated from Human Glioblastoma Stem Cell Secretome by Sequential Centrifugal Ultrafiltration.
Di Giuseppe F, Carluccio M, Zuccarini M, Giuliani P, Ricci-Vitiani L, Pallini R, De Sanctis P, Di Pietro R, Ciccarelli R, Angelucci S. Di Giuseppe F, et al. Biomedicines. 2021 Feb 3;9(2):146. doi: 10.3390/biomedicines9020146. Biomedicines. 2021. PMID: 33546239 Free PMC article. - Proteomic profiling of oleamide-mediated polarization in a primary human monocyte-derived tumor-associated macrophages (TAMs) model: a functional analysis.
Wisitpongpun P, Buakaew W, Pongcharoen S, Apiratmateekul N, Potup P, Daowtak K, Krobthong S, Yingchutrakul Y, Brindley PJ, Usuwanthim K. Wisitpongpun P, et al. PeerJ. 2024 Sep 18;12:e18090. doi: 10.7717/peerj.18090. eCollection 2024. PeerJ. 2024. PMID: 39308806 Free PMC article. - Sonication is a suitable method for loading nanobody into glioblastoma small extracellular vesicles.
Colja S, Jovčevska I, Šamec N, Romih R, Zottel A. Colja S, et al. Heliyon. 2023 Apr 21;9(5):e15674. doi: 10.1016/j.heliyon.2023.e15674. eCollection 2023 May. Heliyon. 2023. PMID: 37131433 Free PMC article.
References
- Miranda A, Blanco-Prieto M, Sousa J, et al. Breaching barriers in glioblastoma. Part I: molecular pathways and novel treatment approaches. Int J Pharm 2017; 531: 372–388. - PubMed
LinkOut - more resources
Full Text Sources
Research Materials
Miscellaneous


