Altered glucocorticoid metabolism represents a feature of macroph-aging - PubMed (original) (raw)
Altered glucocorticoid metabolism represents a feature of macroph-aging
Jenny Vanessa Valbuena Perez et al. Aging Cell. 2020 Jun.
Abstract
The aging process is characterized by a chronic, low-grade inflammatory state, termed "inflammaging." It has been suggested that macrophage activation plays a key role in the induction and maintenance of this state. In the present study, we aimed to elucidate the mechanisms responsible for aging-associated changes in the myeloid compartment of mice. The aging phenotype, characterized by elevated cytokine production, was associated with a dysfunction of the hypothalamic-pituitary-adrenal (HPA) axis and diminished serum corticosteroid levels. In particular, the concentration of corticosterone, the major active glucocorticoid in rodents, was decreased. This could be explained by an impaired expression and activity of 11β-hydroxysteroid dehydrogenase type 1 (11β-HSD1), an enzyme that determines the extent of cellular glucocorticoid responses by reducing the corticosteroids cortisone/11-dehydrocorticosterone to their active forms cortisol/corticosterone, in aged macrophages and peripheral leukocytes. These changes were accompanied by a downregulation of the glucocorticoid receptor target gene glucocorticoid-induced leucine zipper (GILZ) in vitro and in vivo. Since GILZ plays a central role in macrophage activation, we hypothesized that the loss of GILZ contributed to the process of macroph-aging. The phenotype of macrophages from aged mice was indeed mimicked in young GILZ knockout mice. In summary, the current study provides insight into the role of glucocorticoid metabolism and GILZ regulation during aging.
Keywords: TSC22D3; cellular immunology; cytokines; inflammation; mononuclear cell; mouse models; reactive oxygen species; steroid control of aging.
© 2020 The Authors. Aging Cell published by the Anatomical Society and John Wiley & Sons Ltd.
Conflict of interest statement
The authors declare no conflict of interest.
Figures
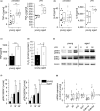
FIGURE 1
Inflammation in aged mice. Levels of TNF‐α (a) and IL‐6 (b) in sera from young (10 weeks) and aged (20–22 months) C57BL/6 mice as determined by ELISA; untreated: n = 12 (young) or n = 15 (aged), LPS (5 mg/kg BW, 4 hr): n = 6. (c) PMs obtained from young and aged mice were stimulated with LPS (100 ng/ml, 4 hr), and TNF was quantified in the supernatants by bioassay (n = 4, triplicates). (d) H2O2 production was measured in PM supernatants by homovanillic acid assay (young: n = 5, aged: n = 6). (e, f) ERK phosphorylation after LPS treatment (100 ng/ml) was examined by Western blot. Total ERK (tERK) and tubulin served as loading controls. (e) One representative blot out of six is shown. (f) pERK1/2 signal intensities were normalized to total ERK1/2. Values for untreated cells from young mice were set as 1 (n = 6 in replicates). (g) Gene expression in PMs from young and aged mice was determined by qPCR and normalized against the housekeeping gene (Ppia). Values for PMs from young mice were set as 1 (n = 14). Box plots show the 25–75th percentiles (box), mean (square), median (line), and SD (whiskers). Bars show the mean ± SEM, and circles within bars indicate the mean of each individual experiment. *p < .05, **p < .01, ***p < .001 by two‐tailed t test (a–c), Mann–Whitney U test (d, g), or ANOVA with Bonferroni's post hoc test (f)
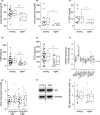
FIGURE 2
Decreased GC levels in aged mice. (a) Total serum corticosteroid levels were quantified in sera of young (n = 24) and aged (n = 15) mice by ELISA. (b, c) Corticosterone (b) and 11‐dehydrocorticosterone (11‐DHC, c) concentrations were determined in sera of young (n = 15) and aged (n = 7) mice by LC‐HRMS/MS. (d, e) CRH (d) and ACTH (e) levels were determined in sera of young (n = 34) and aged (n = 33) mice by ELISA. (f) Expression levels of genes involved in cholesterol homeostasis and corticosteroid biosynthesis were measured in adrenal glands from young (n = 12) and aged (n = 8) mice by qPCR, normalized against the housekeeping gene (Csnk2a2), and expressed as x‐fold of samples from young mice. (g) Expression of GR mRNA (Nr3c1) in PMs and PBLs from young and aged mice (n = 14). Data were normalized against the housekeeping gene (Ppia) and are expressed as fold change of young. (h, i) GR protein levels were measured by Western blot in PMs obtained from young (n = 12) and aged (n = 16) mice. (h) Representative blot. (i) GR signal intensities were normalized to the loading control GAPDH and are expressed as _x_‐fold of young. Box plots show the 25–75th percentiles (box), mean (circle), median (line), and SD (whiskers). *p < .05, **p < .01, ***p < .001 by two‐tailed t test (a, d, e) or Mann–Whitney U test (b, c, f)
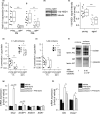
FIGURE 3
Alterations in GC metabolism in aged immune cells. (a) Hsd11b1 expression in PMs and PBLs from young and aged mice (n = 14) was measured by RT‐qPCR, normalized to Ppia, and expressed as x‐fold of young. (b, c) 11β‐HSD1 protein expression was measured in PMs (young: n = 12, aged: n = 11). (b) Representative blot. (c) Densitometric analysis, normalized to the housekeeping protein tubulin. Values for young mice were set as 1. (d, e) PMs isolated from young and aged animals (n = 10) were incubated for 1 or 24 hr with 0.1 µM (d) or 1 µM (e) cortisone‐D8, and the conversion to cortisol‐D8 was measured in supernatants by LC‐HRMS/MS. Conversion percentages were normalized to total protein content. (f, g) THP‐1 macrophages were treated with either vehicle (0.1% DMSO) or the 11β‐HSD1 inhibitor PF915275 (100 nM) for 1 hr, followed by cortisone treatment (100 nM) for 4 hr. (f) GR content in nuclear and cytosolic fractions was analyzed by Western blot. Lamin (A/C) was used as an indicator for the presence or absence of nuclear proteins. One representative blot is shown. Densitometric quantification data are presented as x‐fold of the nuclear/cytosolic GR ratio in cortisone‐treated cells (n = 4, *p < .05 versus cortisone‐treated cells). (g) GR‐dependent gene expression was analyzed by qPCR and normalized to the housekeeping gene ACTB. Data are presented as x‐fold of vehicle‐treated cells (n = 3, triplicates). (h) PMs obtained from young mice were treated with either vehicle (0.1% DMSO) or PF915275 (100 nM) for 1 hr, followed by cortisone treatment (100 nM) for 4 hr. Gilz and Dusp1 expression were analyzed by qPCR, normalized to the housekeeping gene Ppia, and expressed as x‐fold of vehicle control (n = 8). Box plots show the 25–75th percentiles (box), mean (circle), median (line), and SD (whiskers). Bars show the mean ± SEM. *p < .05, **p < .01, ***p < .001 by two‐tailed t test (a, c), one‐sample t test (f), Mann–Whitney U test (d, e), or ANOVA with Bonferroni's post hoc test (g, h)
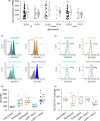
FIGURE 4
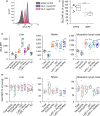
GILZ expression in human and murine blood samples from young and aged individuals. (a) GILZ expression in human blood samples. Expression data were retrieved from the GTEx database and are shown as TPM (transcripts per million) (20–29 years: 27 ♀, 57 ♂; 70–79 years: 9 ♀, 18 ♂). (b) Representative histograms showing GILZ expression in myeloid subsets in young mice. Colored: GILZ signal; gray: isotype control. (c) Representative histograms showing GILZ signals in cells from aged and young mice. Gray line: young; colored line: aged. (d) Background‐subtracted GILZ median fluorescence intensity (MFI) in myeloid blood cells from young mice (n = 14). **p < .01, ***p < .001 compared with MFI values for total CD45+ cells by ANOVA with Bonferroni's post hoc test. (e) GILZ expression in myeloid subsets of aged mice (n = 13). The GILZ MFI of young cells was set as 100% for each subset.Box plots show the 25‐75th percentile (box), mean (circle), median (line), and SD (whiskers). *p < .05, **p < .01 compared with the same subset in young animals by Mann–Whitney U test. Mono: monocytes
FIGURE 5
GILZ expression in myeloid cells from young and aged mice. (a, b) GILZ expression in PMs from young and aged mice was determined by flow cytometry. (a) Representative histogram. (b) Background‐subtracted GILZ median fluorescence intensity (MFI) (young: n = 8, aged: n = 10). (c) GILZ MFI in myeloid cells in the liver and lymphoid tissues of young mice (n = 10). ***p < .001 compared with MFI values for total CD45+ (liver) or total cells (spleen and lymph node), ## p < .01, ### p < .001 compared with all other subsets (ANOVA with Bonferroni's post hoc test. (d) GILZ expression in myeloid subsets of aged mice. The GILZ MFI of young cells was set as 100% for each subset (n = 8). *p < .05, **p < .01, ***p < .001 compared with the same subset in young animals by Mann–Whitney U test. Box plots show the 25–75th percentiles (box), mean (circle), median (line), and SD (whiskers). Mono: monocytes; Mo/Mac: monocytes and macrophages; cDC: classical dendritic cells; KC: Kupffer cells
FIGURE 6
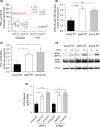
GILZ knockout mimics inflammaging. (a) Serum TNF‐α levels in young GILZ knockout (KO) mice were determined by ELISA and compared with serum concentrations in young and aged wild‐type (WT) mice (see Figure 1). The mean of the values for young untreated WT mice was set as 1 (blue line). The red line indicates the mean TNF‐α level in LPS‐treated young WT mice, expressed as x‐fold of untreated young WT mice. Untreated young KO: n = 12, LPS‐treated young KO (5 mg/kg BW, 4 hr): n = 6. *p < .05, **p < .01 compared with equally treated young WT animals by ANOVA with Bonferroni's post hoc test. (b) PMs obtained from young and aged WT, as well as young KO mice, were stimulated with LPS (100 ng/ml, 4 hr), and TNF production was assessed by bioassay. Values for young WT mice were set as 1 (n = 4, triplicates). (c) H2O2 production was measured in PM supernatants by homovanillic acid assay (young WT and KO: n = 5, aged: n = 6). (d, e) ERK phosphorylation after LPS treatment (100 ng/ml, 15') was analyzed by Western blot. (d) One representative blot out of six is shown. Total ERK (tERK) and tubulin served as loading controls. (e) Densitometric analysis of LPS‐induced ERK phosphorylation. pERK1/2 signal intensities were normalized to tERK1/2 and expressed as x‐fold of young WT. Box plots show the 25–75th percentiles (box), mean (circle), median (line), and SD (whiskers). Bars show the mean ± SEM, and circles within bars indicate the mean of each experiment. *p < .05, **p < .01, ***p < .001 by ANOVA with Bonferroni's post hoc test
Similar articles
- Local amplification of glucocorticoids by 11 beta-hydroxysteroid dehydrogenase type 1 promotes macrophage phagocytosis of apoptotic leukocytes.
Gilmour JS, Coutinho AE, Cailhier JF, Man TY, Clay M, Thomas G, Harris HJ, Mullins JJ, Seckl JR, Savill JS, Chapman KE. Gilmour JS, et al. J Immunol. 2006 Jun 15;176(12):7605-11. doi: 10.4049/jimmunol.176.12.7605. J Immunol. 2006. PMID: 16751407 - Local amplification of glucocorticoids by 11beta-hydroxysteroid dehydrogenase type 1 and its role in the inflammatory response.
Chapman KE, Coutinho A, Gray M, Gilmour JS, Savill JS, Seckl JR. Chapman KE, et al. Ann N Y Acad Sci. 2006 Nov;1088:265-73. doi: 10.1196/annals.1366.030. Ann N Y Acad Sci. 2006. PMID: 17192572 Review. - Glucocorticoid-induced leucine zipper (GILZ) in immuno suppression: master regulator or bystander?
Hoppstädter J, Kiemer AK. Hoppstädter J, et al. Oncotarget. 2015 Nov 17;6(36):38446-57. doi: 10.18632/oncotarget.6197. Oncotarget. 2015. PMID: 26498359 Free PMC article. - The role of 11beta-hydroxysteroid dehydrogenases in the brain.
Holmes MC, Seckl JR. Holmes MC, et al. Mol Cell Endocrinol. 2006 Mar 27;248(1-2):9-14. doi: 10.1016/j.mce.2005.12.002. Epub 2006 Jan 18. Mol Cell Endocrinol. 2006. PMID: 16413106 Review.
Cited by
- Pharmacology of Aging: Drosophila as a Tool to Validate Drug Targets for Healthy Lifespan.
Dos Santos E, Cochemé HM. Dos Santos E, et al. Aging Biol. 2024 Sep 13;2(1):20240034. doi: 10.59368/agingbio.20240034. Aging Biol. 2024. PMID: 39346601 Free PMC article. - Human organ rejuvenation by VEGF-A: Lessons from the skin.
Keren A, Bertolini M, Keren Y, Ullmann Y, Paus R, Gilhar A. Keren A, et al. Sci Adv. 2022 Jun 24;8(25):eabm6756. doi: 10.1126/sciadv.abm6756. Epub 2022 Jun 24. Sci Adv. 2022. PMID: 35749494 Free PMC article. - Anti-Inflammatory Effects of Synthetic Peptides Based on Glucocorticoid-Induced Leucine Zipper (GILZ) Protein for the Treatment of Inflammatory Bowel Diseases (IBDs).
Paglialunga M, Flamini S, Contini R, Febo M, Ricci E, Ronchetti S, Bereshchenko O, Migliorati G, Riccardi C, Bruscoli S. Paglialunga M, et al. Cells. 2023 Sep 16;12(18):2294. doi: 10.3390/cells12182294. Cells. 2023. PMID: 37759516 Free PMC article. - Modulation of recovery from neonatal hyperoxic lung injury by sex as a biological variable.
Cantu A, Gutierrez MC, Dong X, Leek C, Anguera M, Lingappan K. Cantu A, et al. Redox Biol. 2023 Dec;68:102933. doi: 10.1016/j.redox.2023.102933. Epub 2023 Oct 18. Redox Biol. 2023. PMID: 38661305 Free PMC article. - 5-Bis-(2,6-difluoro-benzylidene) Cyclopentanone Acts as a Selective 11β-Hydroxysteroid Dehydrogenase one Inhibitor to Treat Diet-Induced Nonalcoholic Fatty Liver Disease in Mice.
Guan H, Wang Y, Li H, Zhu Q, Li X, Liang G, Ge RS. Guan H, et al. Front Pharmacol. 2021 Apr 12;12:594437. doi: 10.3389/fphar.2021.594437. eCollection 2021. Front Pharmacol. 2021. PMID: 33912032 Free PMC article.
References
- Arai, Y. , Martin‐Ruiz, C. M. , Takayama, M. , Abe, Y. , Takebayashi, T. , Koyasu, S. , … von Zglinicki, T. (2015). Inflammation, but not telomere length, predicts successful ageing at extreme old age: A longitudinal study of semi‐supercentenarians. EBioMedicine, 2(10), 1549–1558. 10.1016/j.ebiom.2015.07.029 - DOI - PMC - PubMed
- Ayala‐Sumuano, J. T. , Velez‐delValle, C. , Beltran‐Langarica, A. , Marsch‐Moreno, M. , Hernandez‐Mosqueira, C. , & Kuri‐Harcuch, W. (2013). Glucocorticoid paradoxically recruits adipose progenitors and impairs lipid homeostasis and glucose transport in mature adipocytes. Scientific Reports, 3, 2573 10.1038/srep02573 - DOI - PMC - PubMed
Publication types
MeSH terms
Substances
LinkOut - more resources
Full Text Sources
Medical
Molecular Biology Databases
