Uneven Missing Data Skew Phylogenomic Relationships within the Lories and Lorikeets - PubMed (original) (raw)
Uneven Missing Data Skew Phylogenomic Relationships within the Lories and Lorikeets
Brian Tilston Smith et al. Genome Biol Evol. 2020.
Abstract
The resolution of the Tree of Life has accelerated with advances in DNA sequencing technology. To achieve dense taxon sampling, it is often necessary to obtain DNA from historical museum specimens to supplement modern genetic samples. However, DNA from historical material is generally degraded, which presents various challenges. In this study, we evaluated how the coverage at variant sites and missing data among historical and modern samples impacts phylogenomic inference. We explored these patterns in the brush-tongued parrots (lories and lorikeets) of Australasia by sampling ultraconserved elements in 105 taxa. Trees estimated with low coverage characters had several clades where relationships appeared to be influenced by whether the sample came from historical or modern specimens, which were not observed when more stringent filtering was applied. To assess if the topologies were affected by missing data, we performed an outlier analysis of sites and loci, and a data reduction approach where we excluded sites based on data completeness. Depending on the outlier test, 0.15% of total sites or 38% of loci were driving the topological differences among trees, and at these sites, historical samples had 10.9× more missing data than modern ones. In contrast, 70% data completeness was necessary to avoid spurious relationships. Predictive modeling found that outlier analysis scores were correlated with parsimony informative sites in the clades whose topologies changed the most by filtering. After accounting for biased loci and understanding the stability of relationships, we inferred a more robust phylogenetic hypothesis for lories and lorikeets.
Keywords: bird; likelihood; museum DNA; museum specimen; parrot; phylogeny.
© The Author(s) 2020. Published by Oxford University Press on behalf of the Society for Molecular Biology and Evolution.
Figures
Fig. 1
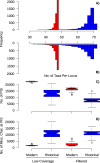
Modern samples have more parsimony informative sites (PIS), less missing data at PIS, and less variation in number of samples among loci. Shown are histograms of the number of samples per locus in the Low Coverage (A) and Filtered (B) alignments. (C, D) Boxplots showing the number of parsimony informative sites (C) and number of missing characters at parsimony informative sites (D) in the ingroup samples. The data are partitioned into the modern versus historical samples, and Low Coverage versus Filtered alignments. In all plots, modern samples are shown in red and historical samples in blue.
Fig. 2
Alternative topologies for the subclade that differs the most among filtering schemes. Shown is the subclade containing Trichoglossus/Eos/Psitteuteles iris/Glossopsitta from trees estimated without (A: Filtered Tree) and with low coverage characters (B: Low Coverage Tree). In the Low Coverage tree are clades composed of mostly historical versus modern samples. Bootstrap nodes are colored on a gradient from 100% (black) to <70% (gray). Taxon names are colored according to whether their DNA came from modern tissues (red) or historical specimens (blue).
Fig. 3
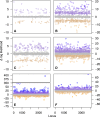
Outlier sites have high missing data in historical samples. (A) Outlier site plot showing Δ sites-wise log-likelihoods (Δ s-lk) for topologies estimated with and without low coverage sites. The y axis is the Δ s-lk score and the x axis represents individual sites in the concatenated alignment, where K and M represent thousand and million, respectively. Points are colored according to the magnitude of the Δ site-wise log-likelihood scores according to a gradient reflecting the different likelihood thresholds (>2, >10, >20, <−2, <−10, and <−20). (_B_) Boxplot of historical (blue) and modern (red) samples showing the amount of missing data in the 3,084 outlier sites (Δ s-lk > 2) identified in plot A.
Fig. 4
Likelihood plots showing Δ locus-wise log-likelihood (Δ l-lk) for topologies estimated with and without missing data for the Low Coverage data set. The y axis is the Δ l-lk and the x axis represents individual loci across the full alignment. Shown are the results for six subclades assessed within Loriini using the Low Coverage data set: (A) Parvipsitta and Psitteuteles, (B) Chalcopsitta and Pseudeos, (C) Neopsittacus, (D) Charmosyna, Vini, and Phigys, (E) Eos, Trichoglossus, Glossopsitta concinna, and Psitteuteles iris, and (F) Lorius. Points are colored according to the magnitude of the Δ l-lk scores according to a gradient ranging from >20 (blue) through <−10 (orange).
Fig. 5
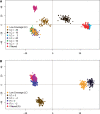
Multidimensional scaling of Robinson–Foulds distances among 100 bootstrap trees with differing levels of outlier sites or loci excluded. (A) Compares distances among Filtered and Low Coverage trees where outlier sites have been removed at different increments. Outlier sites were excluded in the Low Coverage alignment using Δ site-wise log-likelihood (Δ s-lk) thresholds of >20, >10, >2, <−2, <−10, and <−20. (_B_) The distances among trees produced from the subclade outlier analyses. Shown is a comparison of the Low Coverage and Filtered trees with topologies estimated with outlier loci excluded using Δ locus-wise log-likelihood (Δ l-lk) thresholds of >2 and <−2.
Fig. 6
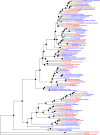
Maximum likelihood tree containing unique taxa in Loriini. The tree was inferred from a concatenated alignment where loci identified with the locus likelihood analysis with Δ locus-wise log-likelihood (Δ l-lk) values of >10 were excluded. On each node are shown rapid bootstrap values and the taxon names are colored according to whether their DNA came from modern tissues (red) or historical specimens (blue). Bootstrap nodes are colored on a gradient from 100% (black) to <70% (gray).
Similar articles
- Phylogenetic relationships within parrots (Psittacidae) inferred from mitochondrial cytochrome-b gene sequences.
Astuti D, Azuma N, Suzuki H, Higashi S. Astuti D, et al. Zoolog Sci. 2006 Feb;23(2):191-8. doi: 10.2108/zsj.23.191. Zoolog Sci. 2006. PMID: 16603811 - Sequence capture phylogenomics of historical ethanol-preserved museum specimens: Unlocking the rest of the vault.
Derkarabetian S, Benavides LR, Giribet G. Derkarabetian S, et al. Mol Ecol Resour. 2019 Nov;19(6):1531-1544. doi: 10.1111/1755-0998.13072. Epub 2019 Sep 18. Mol Ecol Resour. 2019. PMID: 31448547 - Phylogenomic Analysis of the Parrots of the World Distinguishes Artifactual from Biological Sources of Gene Tree Discordance.
Smith BT, Merwin J, Provost KL, Thom G, Brumfield RT, Ferreira M, Mauck WM, Moyle RG, Wright TF, Joseph L. Smith BT, et al. Syst Biol. 2023 May 19;72(1):228-241. doi: 10.1093/sysbio/syac055. Syst Biol. 2023. PMID: 35916751 - Molecular phylogenetics suggests a New Guinean origin and frequent episodes of founder-event speciation in the nectarivorous lories and lorikeets (Aves: Psittaciformes).
Schweizer M, Wright TF, Peñalba JV, Schirtzinger EE, Joseph L. Schweizer M, et al. Mol Phylogenet Evol. 2015 Sep;90:34-48. doi: 10.1016/j.ympev.2015.04.021. Epub 2015 Apr 28. Mol Phylogenet Evol. 2015. PMID: 25929786
Cited by
- Orthoptera-specific target enrichment (OR-TE) probes resolve relationships over broad phylogenetic scales.
Shin S, Baker AJ, Enk J, McKenna DD, Foquet B, Vandergast AG, Weissman DB, Song H. Shin S, et al. Sci Rep. 2024 Sep 13;14(1):21377. doi: 10.1038/s41598-024-72622-6. Sci Rep. 2024. PMID: 39271747 Free PMC article. - The effect of missing data on evolutionary analysis of sequence capture bycatch, with application to an agricultural pest.
Featherstone LA, McGaughran A. Featherstone LA, et al. Mol Genet Genomics. 2024 Feb 21;299(1):11. doi: 10.1007/s00438-024-02097-7. Mol Genet Genomics. 2024. PMID: 38381254 Free PMC article. - Appendage-Bearing Sordariomycetes from Dipterocarpus alatus Leaf Litter in Thailand.
Samaradiwakara NP, de Farias ARG, Tennakoon DS, Aluthmuhandiram JVS, Bhunjun CS, Chethana KWT, Kumla J, Lumyong S. Samaradiwakara NP, et al. J Fungi (Basel). 2023 May 29;9(6):625. doi: 10.3390/jof9060625. J Fungi (Basel). 2023. PMID: 37367561 Free PMC article. - Evaluation of Arabian Vascular Plant Barcodes (rbcL and matK): Precision of Unsupervised and Supervised Learning Methods towards Accurate Identification.
Jamdade R, Upadhyay M, Al Shaer K, Al Harthi E, Al Sallani M, Al Jasmi M, Al Ketbi A. Jamdade R, et al. Plants (Basel). 2021 Dec 13;10(12):2741. doi: 10.3390/plants10122741. Plants (Basel). 2021. PMID: 34961211 Free PMC article. - A phylogenomic perspective on the evolutionary history of the stonefly genus Suwallia (Plecoptera: Chloroperlidae) revealed by ultraconserved genomic elements.
Houston DD, Satler JD, Stack TK, Carroll HM, Bevan AM, Moya AL, Alexander KD. Houston DD, et al. Mol Phylogenet Evol. 2022 Jan;166:107320. doi: 10.1016/j.ympev.2021.107320. Epub 2021 Oct 7. Mol Phylogenet Evol. 2022. PMID: 34626810 Free PMC article.
References
- Amadon D. 1943. Birds collected during the Whitney South Sea Expedition. LII, Notes on some non-passerine genera, 3. Am Mus Novit. 1237:1–22.
- Andersen MJ, Fatdal L, Mauck WM III, Smith BT.. 2017. An ornithological survey of Vanuatu on the islands of Éfaté, Malakula, Gaua, and Vanua Lava. Check List 13(6):755–782.
- Andersen MJ, McCullough JM, Mauck WM III, Smith BT, Moyle RG.. 2018. A phylogeny of kingfishers reveals an Indomalayan origin and elevated rates of diversification on oceanic islands. J Biogeogr. 45(2):269–281.
- Andersen MJ, et al.2019. Ultraconserved elements resolve genus-level relationships in a major Australasian bird radiation (Aves: Meliphagidae). Emu Austral Ornithol. 119(3):218–232.
- Arcila D, et al.2017. Genome-wide interrogation advances resolution of recalcitrant groups in the tree of life. Nat Ecol Evol. 1:0020. - PubMed
MeSH terms
LinkOut - more resources
Full Text Sources
Other Literature Sources


