Wbox2: A clathrin terminal domain-derived peptide inhibitor of clathrin-mediated endocytosis - PubMed (original) (raw)
Wbox2: A clathrin terminal domain-derived peptide inhibitor of clathrin-mediated endocytosis
Zhiming Chen et al. J Cell Biol. 2020.
Abstract
Clathrin-mediated endocytosis (CME) occurs via the formation of clathrin-coated vesicles from clathrin-coated pits (CCPs). Clathrin is recruited to CCPs through interactions between the AP2 complex and its N-terminal domain, which in turn recruits endocytic accessory proteins. Inhibitors of CME that interfere with clathrin function have been described, but their specificity and mechanisms of action are unclear. Here we show that overexpression of the N-terminal domain with (TDD) or without (TD) the distal leg inhibits CME and CCP dynamics by perturbing clathrin interactions with AP2 and SNX9. TDD overexpression does not affect clathrin-independent endocytosis or, surprisingly, AP1-dependent lysosomal trafficking from the Golgi. We designed small membrane-permeant peptides that encode key functional residues within the four known binding sites on the TD. One peptide, Wbox2, encoding residues along the W-box motif binding surface, binds to SNX9 and AP2 and potently and acutely inhibits CME.
© 2020 Chen et al.
Figures
Figure 1.
TDD structure and three possible mechanisms of CME inhibition. (A) Domain structure of clathrin triskelion. Box indicates the TDD of CHC construct used in this study. (B) TD of CHC (PDB accession no. 1BPO). Four reported binding sites are labeled with different colors, and key functional residues are shown as spheres. (C) Cartoon to illustrate potential TDD inhibitory mechanisms: (1) TDD is incorporated into and destabilizes/weakens the clathrin coat, thus inhibiting CCP maturation; (2) TDD competes for AP2 and inhibits AP2–clathrin interactions; (3) TDD competes for other EAPs required for CCP growth and maturation.
Figure S1.
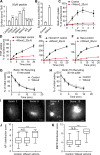
Optimization of recombinant adenoviral system in ARPE cells. The amounts of TDD and helper tTA adenoviruses were optimized for uniform infection of ARPE cells. (A) Relative TDD expression level after infection with 12 µl tTA recombinant adenovirus and the indicated volumes of TDD recombinant adenoviruses. (B) Relative TDD expression level after infection with 20 µl TDD recombinant adenovirus and the indicated volumes of tTA recombinant adenoviruses. (C) Immunofluorescence of surface-bound TfnR with or without TDD expression. Scale bars = 20 µm; inset scale bars = 5 µm. (D–F) Effects of TDD overexpression on Biotin-Tfn uptake revealed that TDD expression enhanced surface bound Biotin-Tfn (D) and reduced its uptake efficiency in single-round (E) and multiround (F) Biotin-Tfn uptake. Average value ± SD are from n = 4 replicates. ***, P ≤ 0.001.
Figure 2.
TDD specifically inhibits CME in a concentration-dependent manner. (A) Regulation of TDD expression was achieved by adjusting the Tet concentration in the Tet-off system. 350,000 ARPE cells in a six-well plate were infected with 12 µl TDD recombinant adenovirus and 12 µl tTA recombinant adenoviruses in the presence of the indicated concentrations of Tet. (B and C) Effects of increasing levels of TDD expression on the levels of surface bound TfnR (B) and the rate and efficiency of TfnR uptake (C) assayed in adenovirus-infected ARPE cells in the presence of the indicated concentrations of Tet. (D) Effects of TDD expression (0 ng/ml Tet) on Biotin-Tfn recycling of a 10- or 30-min pulse in adenovirus-infected ARPE/HPV cells with or without Tet. (E and F) Effect of TDD expression (0 ng/ml Tet) on the fluid phase uptake of HRP (E) or CIE (F) of CD44 or CD59 in ARPE/HPV cells. [Tet] = 20 ng/ml in D–F. Data ± SD are from n = 4 replicates. N.S., not significant.
Figure 3.
Effects of TDD expression on CCP dynamics. (A and B) Single frame from TIRFM videos (7.5 min/video, see Videos 1 and 2) and corresponding kymographs from region indicated by gray line of adenovirally infected ARPE/HPV cells expressing eGFP-CLCa without (A) and with (B) TDD expression. Arrowheads point to examples of dynamic CCSs subjected to cmeAnalysis. (C) Effect of TDD expression on the growth and stabilization of CCPs, as measured by the rates of initiation of subthreshold CCSs and bona fide CCPs. n = 10 videos; Student’s t test. For box and whisker plots, the boxes encompass the 25th and 75th percentiles, the lines represent the medians, and the whiskers show the minima and maxima data points. (D and E) Mean clathrin fluorescence intensity traces in lifetime cohorts of analyzed clathrin structures (D) and corresponding rate of clathrin recruitment determined by the mean slopes of growth phase (from t = 3 s to t = 8 s; E), indicated by blue arrows in D. Each dot represents the mean slope of a cohort. (F) Maximum fluorescence intensity (_I_max) distribution of analyzed CCPs. (G) Lifetime distribution of bona fide CCPs. (H) Median lifetime (LT_50) of analyzed CCPs. Each dot represents a video. Data presented were obtained from a single experiment that is representative of four independent repeats. n = 10 videos for each condition. Number of dynamic tracks analyzed: 124,453 for –TDD and 99,846 for +TDD. Error bars are SD. ***, P ≤ 0.001.
Figure S2.
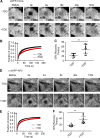
Clathrin and AP2 exchange on plasma membrane is inhibited by TDD expression. (A–C) FRAP was conducted at 37°C in ARPE/HPV eGFP-CLCa cells with or without TDD overexpression using a confocal microscope. (A) Representative time-lapse FRAP images. (B) Average fluorescent intensity traces of the photobleached area (dark square at t = 0 s). (C) Time required for 50% fluorescence recovery. (D–F) FRAP was conducted at 37°C in ARPE α-eGFP-AP2 cells with or without TDD overexpression using a confocal microscope. (D) Representative time-lapse FRAP images. (E) Average fluorescent intensity traces of the photobleached area (dark square at t = 0 s). (F) Time required for 50% fluorescence recovery. Error bars are SD from n = 8 experiments. Scale bars = 3 µm. The lines in these scatter dot plots represent the means with SD. **, P ≤ 0.01.
Figure S3.
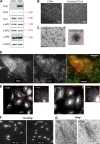
Effect of TDD expression on endogenous protein expression, clathrin-coat stability, and AP1-mediated clathrin trafficking from Golgi. (A) ARPE/HPV cells expressing eGFP-CLCa cells were treated with or without TDD overexpression. TDD expression did not alter the expression levels of endogenous clathrin or AP2. (B) Representative TIRF images of CCPs in live cells or isolated TCVs. Scale bars = 5 µm. (C) Representative EM images showing the collapsed coats typical of isolated TCVs. Scale bars = 200 nm. (D) Immunostaining of HA-TDD in ARPE/HPV eGFP-CLCa cells. Scale bar = 10 µm. (E–G) ARPE cells were treated with or without TDD overexpression. Immunostaining of AP1 γ subunit (E) and GM-130 cis-Golgi marker (F) were imaged with wide-field microscopy. Scale bars = 10 µm. (G) Representative EM images of Golgi apparatus. Scale bars = 500 nm.
Figure 4.
Defining the mechanism of TDD inhibition. (A) Subcellular fractionation of ARPE cells expressing TDD into membrane and cytosolic fractions. (B) Subcellular fractions to enrich for TX-100–resistant TCVs from ARPE/HPV cells expressing TDD. (C) TIRFM imaging and quantification of clathrin dynamics in ARPE/HPV eGFP-CLCa cells indicates that TD phenocopies TDD by reducing the initiation density of bona fide CCPs to the same extent. Error bars are SD. (D) Cartoon showing the procedure used for immunoprecipitation of HA-TDD from ARPE cell lysate (with or without HA-TDD expression) using HA antibody and Protein G Sepharose 4 Fast Flow antibody purification resin. Mass spectrometry analysis was applied to the coIP samples for protein ID detection. (E) AP2 and SNX9 were identified as the only CME-related protein targets that were reproducibly enriched in the TDD coIPs. Values are average of three independent trials. ***, P ≤ 0.001.
Figure 5.
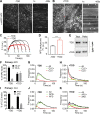
Effects of TDD on AP2-clathrin interactions. (A–D) TIRF imaging of ARPE cells expressing α-eGFP-AP2. Data presented were obtained from a single experiment that is representative of three independent repeats. n = 10 videos for each condition. Number of analyzed tracks: 105,498 for –TDD and 102,207 for +TDD. (A and B) Single frame from TIRFM video (7.5 min/video, see Videos 3 and 4) and corresponding kymographs without (A) and with (B) TDD expression. Arrowheads point to examples of dynamic structures subjected to cmeAnalysis. (C) Mean fluorescence intensity traces of lifetime cohorts of analyzed AP2-labeled structures. Dashed lines indicate the elevation of background fluorescence intensity of AP2 as quantified in D. (E) Representative Western blot of α-AP2 from subcellular fractionation of ARPE cells with or without TDD expression. (F–K) Dual-color TIRFM imaging of ARPE cells expressing both mRuby-CLCa and α-eGFP-AP2. (F–H) Dual-color cmeAnalysis was performed using AP2 as primary channel. Data presented were obtained from a single experiment that is representative of two independent repeats. n = 10 videos for each condition. Number of analyzed tracks: 106,310 for control and 77,932 for +TDD. The percentage of AP2 structures with (CLC+) and without (CLC−) detectable clathrin is shown for –TDD and +TDD cells. (G and H) Comparison of lifetime distributions of all detected AP2 structures and those with (CLC+) or without (CLC−) detected clathrin in –TDD (G) and +TDD (H) cells. (I–K) Same as F–H, except CLC was assigned as the primary channel. Number of analyzed tracks: 172,166 for –TDD and 133,604 for +TDD. Error bars are SD. ***, P ≤ 0.001.
Figure 6.
Effects of SNX9 knockdown on CCP dynamics. (A) Single frame from TIRFM video (7.5 min/video, see Video 5) and corresponding kymograph from region indicated by the gray line of ARPE/HPV cells expressing eGFP-CLCa. (B) Effect of SNX9 knockdown on the initiation rates of bona fide CCPs and subthreshold CCSs. (C) Mean clathrin fluorescence intensity traces of lifetime cohorts of analyzed clathrin structures. Growth phase is indicated by blue arrows. (D) Mean slopes of the fluorescence intensity cohorts shown in C measured during the growth phase from t = 3 s to t = 8 s. Each dot represents mean slope of a cohort. (E) Maximum fluorescence intensity (_I_max) distribution of CCPs in control and SNX9 knockdown cells. (F) Medium lifetime (LT_50) of CCPs in control and SNX9 knockdown cells. Data presented were obtained from a single experiment that is representative of two independent repeats. n = 24 videos for each condition. Number of analyzed tracks: 106,310 for control and 77,932 for +TDD. Number of dynamic tracks analyzed: 294,804 for siControl and 152,013 for siSNX9. Error bars are SD. *, P ≤ 0.05; ***, P ≤ 0.001.
Figure 7.
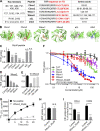
Peptides designed based on TD binding sites inhibit CME. (A) Design of TAT-tagged peptides. Previously reported key residues of the four binding sites in clathrin terminal domain are listed on the left column. Peptides encoded the TAT sequence (black) followed by 10 amino acids derived from TD (red, key residues indicated in bold). Cbox1, Wbox1, a2L, and site4 are peptides derived from the linear TD sequences incorporating the key residues. Cbox2 and Wbox2 were designed to incorporate discontinuous key residues located on adjacent blades, bringing them together in a 10-aa peptide engineered to encompass the entire binding motif. (B) Amino acid sequences of six designed peptides are shown as colored sticks on the TD (PDB accession no. 1BPO). (C) Comparison of the inhibitory activities of the six peptides on TfnR uptake in ARPE/HPV cells. Cells were preincubated with peptides (55 µM) for 60 min at 37°C before uptake assay. Error bars are SD. N.S., not significant. (D) Effect of preincubation time (10–60 min at 37°C, as indicated) on the inhibitory activity of 20 µM Wbox2. (E) Reversibility of Wbox2 inhibition. TfnR uptake efficiency was measured in ARPE/HPV cells immediately after a 1-h preincubation at 37°C with 20 µM WBox2 or after removing peptides and incubating cells at 37°C for 3 and 6 additional hours. (F) Relative TfnR uptake efficiency with increasing concentrations of TAT or the indicated TD-derived peptides, as well as Wbox2_mutant, after 60-min preincubation at 37°C. In C–F, values were normalized to control = 1. Data ± SD are from n = 4 replicates. (G) Effect of Wbox2 peptides on 125I-LDL uptake in human fibroblasts. Data ± SD are from n = 3 replicates. (H and I) Effect of Wbox2 peptides (20 µM) on fluid phase uptake of HRP (H) or CIE of CD44 and CD59 (I). Error bars are SD from n = 4 replicates. ***, P ≤ 0.001.
Figure S4.
Effect of TD-derived peptides on CME, Tfn recycling, and AP1-mediated Golgi trafficking. (A) Effect of the inhibitory activities of the six peptides on the surface-bound TfnR. (B and C) Single-round Biotin-Tfn uptake revealed that Wbox2 strongly enhanced surface bound Biotin-Tfn (B) and reduced Biotin-Tfn uptake efficiency (C). (D–F) The Wbox2 peptide inhibited TfnR uptake in Fibroblast, HCC4017, and HeLa cells. (G and H) Effects of Wbox2 on Biotin-Tfn recycling after either 10- or 30-min pulse. (I–K) Immunostaining of AP1 γ-adaptin and M6PR in control HeLa cells as well as cells treated with Wbox2 (10 µM, preincubation for 30 min at 37°C) or siRNA knockdown CLCa+b (siCLCs). The AP1 and M6RP distribution in cells was quantified by grading them on the basis of degree of concentration at the perinuclear region: lowest score for completely dispersed phenotype, highest score for majority of signal being concentrated at perinuclear region, as representative images of M6PR shown in I. Scale bars = 10 µm. (J and K) Wbox2 treatment did not alter AP1 or M6PR distribution, whereas siCLCa+b as a positive control showed a strong effect by accumulating AP1 and M6PR in the perinuclear region. Number of cells quantified in J: 94 for control, 106 for Wbox2, and 33 for siCLCs. Number of cells quantified in K: 95 for control, 62 for Wbox2, and 37 for siCLCs. Error bars are SD. ***, P ≤ 0.001. N.S., not significant.
Figure S5.
Cell viability after Wbox2 treatment. (A) Quantitation of viable cell number after treatment with varied concentrations of TAT and Wbox2 peptides using Cell Counting Kit 8 (CCK-8). (B) Quantification of viable cell number after treatment with 10 or 50 µM of Wbox2 and varied incubation times. Average data ± SD are from n = 4 replicates.
Figure 8.
Wbox2 interferes with AP2–clathrin interactions and alters CCP dynamics. Dual-color TIRFM imaging of ARPE cells expressing mRuby-CLCa and α-eGFP-AP2 and treated with Wbox2. (A and B) Single frame from TIRFM video (7.5 min/video, see Video 6) and corresponding kymographs from region indicated by gray line. (C) Background AP2 fluorescence intensity of cells incubated without or with Wbox2 (20 µM). (D and E) Dual-color cmeAnalysis with either AP2 (D) or CLC (E) assigned as primary channel showing percentage of α-eGFP-AP2 tracks labeled with mRuby-CLCa (D) or mRuby-CLCa tracks labeled with α-eGFP-AP2 (E) determined in the presence of increasing concentrations of Wbox2. Data presented were obtained from a single experiment that is representative of two independent repeats. Number of videos acquired and analyzed: 11 for 0 µM, 10 for 5 µM, 10 for 10 µM, and 11 for 20 µM. Number of dynamic tracks analyzed in D: 43,324 for 0 µM, 34,664 for 5 µM, 33,596 for 10 µM, and 49,273 for 20 µM. Number of dynamic tracks analyzed in E: 65,192 for 0 µM, 42,323 for 5 µM, 49,733 for 10 µM, and 57,758 for 20 µM. Error bars are SD. ***, P ≤ 0.001.
Figure 9.
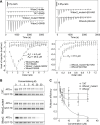
Wbox2 binds to both AP2 and SNX9. (A) ITC measurements of peptide binding to SNX9 and β2 hinge + appendage domain (HAD). Heat curves recorded as a function of time during successive 1.9-µl injection of peptides into the cell containing buffer, SNX9, or β2-HAD. Left: Wbox2 + buffer (1.8 mM Wbox2 injected into reaction buffer); TAT + SNX9 (1.8 mM TAT injected into 50 µM SNX9); Wbox2_mutant + SNX9 (1.8 mM Wbox2_mutant injected into 50 µM SNX9); Wbox2 + SNX9 (1.8 mM Wbox2 injected into 50 µM SNX9). Right: Wbox2_mutant + β2-HAD (1.2 mM Wbox2_mutant injected into 200 µM β2-HAD); Wbox2 + β2-HAD (1.2 mM Wbox2 injected into 200 µM β2-HAD). Heat curves were executed with NITPIC and fitted with SEDPHAT. The fitting model for Wbox2 + SNX9 is A+B+B <–> AB+B <–> BAB, with two nonsymmetric sitesK. The fitting model for Wbox2 + β2-HAD is A+B <–> AB, hetero-association. (B and C) GST-TD (1–580) pulldown of AP2 from mouse brain extract in the presence of increasing concentrations of TAT, Wbox2_mutant, and Wbox2. Representative Western blot images are presented in B and quantified in C. GST-TD was used as loading control, and each data point represents the average and SD from three independent runs.
Similar articles
- Evolving models for assembling and shaping clathrin-coated pits.
Chen Z, Schmid SL. Chen Z, et al. J Cell Biol. 2020 Sep 7;219(9):e202005126. doi: 10.1083/jcb.202005126. J Cell Biol. 2020. PMID: 32770195 Free PMC article. Review. - Temporal Ordering in Endocytic Clathrin-Coated Vesicle Formation via AP2 Phosphorylation.
Wrobel AG, Kadlecova Z, Kamenicky J, Yang JC, Herrmann T, Kelly BT, McCoy AJ, Evans PR, Martin S, Müller S, Salomon S, Sroubek F, Neuhaus D, Höning S, Owen DJ. Wrobel AG, et al. Dev Cell. 2019 Aug 19;50(4):494-508.e11. doi: 10.1016/j.devcel.2019.07.017. Dev Cell. 2019. PMID: 31430451 Free PMC article. - Regulation of clathrin-mediated endocytosis by hierarchical allosteric activation of AP2.
Kadlecova Z, Spielman SJ, Loerke D, Mohanakrishnan A, Reed DK, Schmid SL. Kadlecova Z, et al. J Cell Biol. 2017 Jan 2;216(1):167-179. doi: 10.1083/jcb.201608071. Epub 2016 Dec 21. J Cell Biol. 2017. PMID: 28003333 Free PMC article. - Sorting nexin 9 participates in clathrin-mediated endocytosis through interactions with the core components.
Lundmark R, Carlsson SR. Lundmark R, et al. J Biol Chem. 2003 Nov 21;278(47):46772-81. doi: 10.1074/jbc.M307334200. Epub 2003 Sep 2. J Biol Chem. 2003. PMID: 12952949 - Regulation of Clathrin-Mediated Endocytosis.
Mettlen M, Chen PH, Srinivasan S, Danuser G, Schmid SL. Mettlen M, et al. Annu Rev Biochem. 2018 Jun 20;87:871-896. doi: 10.1146/annurev-biochem-062917-012644. Epub 2018 Apr 16. Annu Rev Biochem. 2018. PMID: 29661000 Free PMC article. Review.
Cited by
- The Chemical Inhibitors of Endocytosis: From Mechanisms to Potential Clinical Applications.
Szewczyk-Roszczenko OK, Roszczenko P, Shmakova A, Finiuk N, Holota S, Lesyk R, Bielawska A, Vassetzky Y, Bielawski K. Szewczyk-Roszczenko OK, et al. Cells. 2023 Sep 19;12(18):2312. doi: 10.3390/cells12182312. Cells. 2023. PMID: 37759535 Free PMC article. Review. - CHC22 clathrin recruitment to the early secretory pathway requires two-site interaction with SNX5 and p115.
Greig J, Bates GT, Yin DI, Briant K, Simonetti B, Cullen PJ, Brodsky FM. Greig J, et al. EMBO J. 2024 Oct;43(19):4298-4323. doi: 10.1038/s44318-024-00198-y. Epub 2024 Aug 19. EMBO J. 2024. PMID: 39160272 Free PMC article. - Insight into the role of clathrin-mediated endocytosis inhibitors in SARS-CoV-2 infection.
Alkafaas SS, Abdallah AM, Ghosh S, Loutfy SA, Elkafas SS, Abdel Fattah NF, Hessien M. Alkafaas SS, et al. Rev Med Virol. 2023 Jan;33(1):e2403. doi: 10.1002/rmv.2403. Epub 2022 Nov 7. Rev Med Virol. 2023. PMID: 36345157 Free PMC article. Review. - Role of Clathrin and Dynamin in Clathrin Mediated Endocytosis/Synaptic Vesicle Recycling and Implications in Neurological Diseases.
Prichard KL, O'Brien NS, Murcia SR, Baker JR, McCluskey A. Prichard KL, et al. Front Cell Neurosci. 2022 Jan 18;15:754110. doi: 10.3389/fncel.2021.754110. eCollection 2021. Front Cell Neurosci. 2022. PMID: 35115907 Free PMC article. Review. - Evolving models for assembling and shaping clathrin-coated pits.
Chen Z, Schmid SL. Chen Z, et al. J Cell Biol. 2020 Sep 7;219(9):e202005126. doi: 10.1083/jcb.202005126. J Cell Biol. 2020. PMID: 32770195 Free PMC article. Review.
References
- Ahle S., and Ungewickell E.. 1989. Identification of a clathrin binding subunit in the HA2 adaptor protein complex. J. Biol. Chem. 264:20089–20093. - PubMed
Publication types
MeSH terms
Substances
Grants and funding
- R37 MH061345/MH/NIMH NIH HHS/United States
- S10 OD021685/OD/NIH HHS/United States
- R01 MH061345/MH/NIMH NIH HHS/United States
- R01 GM042455/GM/NIGMS NIH HHS/United States
- R01 GM073165/GM/NIGMS NIH HHS/United States
LinkOut - more resources
Full Text Sources
Research Materials


