Feature selection strategies for drug sensitivity prediction - PubMed (original) (raw)
Feature selection strategies for drug sensitivity prediction
Krzysztof Koras et al. Sci Rep. 2020.
Abstract
Drug sensitivity prediction constitutes one of the main challenges in personalized medicine. Critically, the sensitivity of cancer cells to treatment depends on an unknown subset of a large number of biological features. Here, we compare standard, data-driven feature selection approaches to feature selection driven by prior knowledge of drug targets, target pathways, and gene expression signatures. We asses these methodologies on Genomics of Drug Sensitivity in Cancer (GDSC) dataset, evaluating 2484 unique models. For 23 drugs, better predictive performance is achieved when the features are selected according to prior knowledge of drug targets and pathways. The best correlation of observed and predicted response using the test set is achieved for Linifanib (r = 0.75). Extending the drug-dependent features with gene expression signatures yields the most predictive models for 60 drugs, with the best performing example of Dabrafenib. For many compounds, even a very small subset of drug-related features is highly predictive of drug sensitivity. Small feature sets selected using prior knowledge are more predictive for drugs targeting specific genes and pathways, while models with wider feature sets perform better for drugs affecting general cellular mechanisms. Appropriate feature selection strategies facilitate the development of interpretable models that are indicative for therapy design.
Conflict of interest statement
The authors declare no competing interests.
Figures
Figure 1
Flowchart describing the modeling framework for a single compound. Abbreviations: GW – genome-wide, PG – pathway genes, OT – only targets, EN – elastic net, RF – random forest, SEL – automated feature selection, S – gene expression signatures. For every feature space, we performed modeling separately for each drug. We randomly split the corresponding data into training and test set, with 0.3 of the data included in the test set. We used 3-fold cross-validation on the training data for hyperparameter tuning and evaluated the best model on the test set. The whole modeling process was repeated five times with different training/test set data splits.
Figure 2
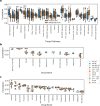
Models’ properties and response variable grouped by target pathways. (a) Number of input features across compounds in different methods. For genome-wide models, number of features was 17737 for each drug. Vertical axis uses log scale. (b) Number of samples across compounds in different methods. Abbreviation SS refers to stability selection (Methods). (c) AUC values grouped by target pathway of the drug, raw data from GDSC. Target pathways are sorted by interquartile range of the AUC values. Pathways corresponding to more general cell mechanisms are marked with red dots. See Fig. 1 for abbreviations.
Figure 3
Predictive performance for all of the analyzed drugs. (a) 1 - RMSE versus correlation per drug, obtained by elastic net using genome-wide gene expression data as predictors. For 1-RMSE, higher values correspond to better performance. (b) Correlation versus standard deviation of true AUC for all cell lines screened for a given drug, correlation obtained by genome-wide elastic net. (c) RelRMSE versus correlation obtained by the best model for a given drug. Higher values of RelRMSE correspond to better performance and improvement over a dummy model, which predicts average AUC. Each point represents a single drug. For each of them, corresponding best performance was determined using correlation as a metric. Colors represent models with feature set that obtained the best performance for a given drug. Horizontal line at 1 represents the baseline RelRMSE score. Most of these correlations are statistically significant (test based on Student’s t-distribution at 0.05 significance level, Fig. S1). (d) Distribution of per-drug predictive performance grouped by per-drug number of available samples. Colors represent models with feature set that obtained the best performance for a given drug. See Fig. 1 for model abbreviations.
Figure 4
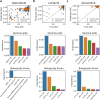
Frequencies of all applied methods among best models per drug. (a) Correlation of AUC predictions with the true AUC values in the test set across compounds in methods with different feature spaces. Results are shown for 175 drugs which were common across all applied models. (b) Model frequencies for compounds for which all methods were applied. (c) Differences in correlation between best model per drug overall and best model from the other class. Two cases are shown – genome-wide and biologically driven feature sets. (d) Model frequencies among best models for compounds where models with biologically driven could not have been applied. See Fig. 1 for abbreviations.
Figure 5
Predictive performance in relation to compounds’ target pathway. (a) Correlation with the test set grouped by pathways. Methods were classified into two groups – one that uses genome-wide feature space, and one with biologically driven feature space. Numbers displayed represent p-values for the one-sided Mann-Whitney-Wilcoxon test. Lack of number means no statistical significance at 0.05 significance level. (b) Predictive performance for drugs with DNA replication target pathway. (c) Predictive performance for drugs with RTK signaling pathway. See Fig. 1 for model abbreviations.
Figure 6
Frequencies of considered feature types among top k most predictive features. Feature importance coefficients were extracted from top 50 drugs in terms of modeling performance using methods with biologically driven feature space.
Figure 7
Results for specific compounds exhibiting good ability to model with one or all of the methods. Displayed numbers represent number of features which was used by the best performing model for a particular drug. Top horizontal axis shows compounds’ target pathways along with the model which achieved the best modeling result. See Fig. 1 for model abbreviations.
Figure 8
Predicted versus actual AUC values and most predictive features for (a) Dabrafenib, (b) Linifanib and (c) Quizartinib. Top panels show predicted versus actual AUC values when both biologically driven and genome-wide models were trained and tested on the same sets of samples. The biologically driven models correspond to best suited feature set for each drug: OT + S RF for Dabrafenib, OT RF for Linifanib and PG RF for Quizartinib. Middle and bottom panels present top 5 most informative features when fitting the model with genome-wide data (middle) and biologically driven feature space (bottom).
Similar articles
- [Dabrafenib: the new inhibitor of hyperactive B-RAF kinase].
Heneberg P. Heneberg P. Klin Onkol. 2012;25(5):333-9. Klin Onkol. 2012. PMID: 23102194 Review. Czech. - Rapid and complete hematological response of refractory hairy cell leukemia to the BRAF inhibitor dabrafenib.
Vergote V, Dierickx D, Janssens A, Verhoef G, Tousseyn T, Vandenberghe P, Wolter P, Delforge M. Vergote V, et al. Ann Hematol. 2014 Dec;93(12):2087-9. doi: 10.1007/s00277-014-2104-2. Epub 2014 May 27. Ann Hematol. 2014. PMID: 24863690 No abstract available. - Sustained response to salvage therapy for dabrafenib-resistant metastatic Langerhans cell sarcoma.
Lorillon G, Mourah S, Vercellino L, de Margerie-Mellon C, Pagès C, Goldwirt L, Lebbe C, Tost J, Tazi A. Lorillon G, et al. Ann Oncol. 2016 Dec;27(12):2305-2307. doi: 10.1093/annonc/mdw299. Epub 2016 Aug 8. Ann Oncol. 2016. PMID: 27502715 No abstract available. - BRAF Adds an Additional Piece of the Puzzle to Precision Oncology-Based Treatment Strategies in Lung Cancer.
Planchard D, Johnson BE. Planchard D, et al. Arch Pathol Lab Med. 2018 Jul;142(7):796-797. doi: 10.5858/arpa.2018-0088-ED. Epub 2018 Apr 12. Arch Pathol Lab Med. 2018. PMID: 29648886 No abstract available. - [Mechanisms of resistance to anti-BRAF treatments].
Charles J, Martel C, de Fraipont F, Leccia MT, Robert C, Busser B. Charles J, et al. Ann Dermatol Venereol. 2014 Nov;141(11):671-81. doi: 10.1016/j.annder.2014.06.021. Epub 2014 Aug 7. Ann Dermatol Venereol. 2014. PMID: 25442471 Review. French.
Cited by
- An overview of machine learning methods for monotherapy drug response prediction.
Firoozbakht F, Yousefi B, Schwikowski B. Firoozbakht F, et al. Brief Bioinform. 2022 Jan 17;23(1):bbab408. doi: 10.1093/bib/bbab408. Brief Bioinform. 2022. PMID: 34619752 Free PMC article. - Prediction of drug sensitivity based on multi-omics data using deep learning and similarity network fusion approaches.
Liu XY, Mei XY. Liu XY, et al. Front Bioeng Biotechnol. 2023 Apr 13;11:1156372. doi: 10.3389/fbioe.2023.1156372. eCollection 2023. Front Bioeng Biotechnol. 2023. PMID: 37139048 Free PMC article. - Representing mutations for predicting cancer drug response.
Wall P, Ideker T. Wall P, et al. Bioinformatics. 2024 Jun 28;40(Suppl 1):i160-i168. doi: 10.1093/bioinformatics/btae209. Bioinformatics. 2024. PMID: 38940147 Free PMC article. - A performance evaluation of drug response prediction models for individual drugs.
Park A, Lee Y, Nam S. Park A, et al. Sci Rep. 2023 Jul 24;13(1):11911. doi: 10.1038/s41598-023-39179-2. Sci Rep. 2023. PMID: 37488424 Free PMC article. - Utilization of Cancer Cell Line Screening to Elucidate the Anticancer Activity and Biological Pathways Related to the Ruthenium-Based Therapeutic BOLD-100.
Park BJ, Raha P, Pankovich J, Bazett M. Park BJ, et al. Cancers (Basel). 2022 Dec 21;15(1):28. doi: 10.3390/cancers15010028. Cancers (Basel). 2022. PMID: 36612025 Free PMC article.
References
- Seashore-Ludlow B, et al. Harnessing Connectivity in a Large-Scale Small-Molecule Sensitivity Dataset. Cancer Discovery. 2015;5:1210–1223. doi: 10.1158/2159-8290.CD-15-0235. - DOI - PMC - PubMed
Publication types
MeSH terms
Substances
LinkOut - more resources
Full Text Sources


