Human postprandial responses to food and potential for precision nutrition - PubMed (original) (raw)
. 2020 Jun;26(6):964-973.
doi: 10.1038/s41591-020-0934-0. Epub 2020 Jun 11.
Ana M Valdes # 2 3, David A Drew 4, Francesco Asnicar 5, Mohsen Mazidi 6, Jonathan Wolf 7, Joan Capdevila 7, George Hadjigeorgiou 7, Richard Davies 7, Haya Al Khatib 1 7, Christopher Bonnett 7, Sajaysurya Ganesh 7, Elco Bakker 7, Deborah Hart 6, Massimo Mangino 6, Jordi Merino 8 9 10 11, Inbar Linenberg 7, Patrick Wyatt 7, Jose M Ordovas 12 13, Christopher D Gardner 14, Linda M Delahanty 15, Andrew T Chan 4, Nicola Segata # 5, Paul W Franks # 6 16 17, Tim D Spector # 18
Affiliations
- PMID: 32528151
- PMCID: PMC8265154
- DOI: 10.1038/s41591-020-0934-0
Human postprandial responses to food and potential for precision nutrition
Sarah E Berry et al. Nat Med. 2020 Jun.
Erratum in
- Publisher Correction: Human postprandial responses to food and potential for precision nutrition.
Berry SE, Valdes AM, Drew DA, Asnicar F, Mazidi M, Wolf J, Capdevila J, Hadjigeorgiou G, Davies R, Khatib HA, Bonnett C, Ganesh S, Bakker E, Hart D, Mangino M, Merino J, Linenberg I, Wyatt P, Ordovas JM, Gardner CD, Delahanty LM, Chan AT, Segata N, Franks PW, Spector TD. Berry SE, et al. Nat Med. 2020 Nov;26(11):1802. doi: 10.1038/s41591-020-1130-y. Nat Med. 2020. PMID: 33082577
Abstract
Metabolic responses to food influence risk of cardiometabolic disease, but large-scale high-resolution studies are lacking. We recruited n = 1,002 twins and unrelated healthy adults in the United Kingdom to the PREDICT 1 study and assessed postprandial metabolic responses in a clinical setting and at home. We observed large inter-individual variability (as measured by the population coefficient of variation (s.d./mean, %)) in postprandial responses of blood triglyceride (103%), glucose (68%) and insulin (59%) following identical meals. Person-specific factors, such as gut microbiome, had a greater influence (7.1% of variance) than did meal macronutrients (3.6%) for postprandial lipemia, but not for postprandial glycemia (6.0% and 15.4%, respectively); genetic variants had a modest impact on predictions (9.5% for glucose, 0.8% for triglyceride, 0.2% for C-peptide). Findings were independently validated in a US cohort (n = 100 people). We developed a machine-learning model that predicted both triglyceride (r = 0.47) and glycemic (r = 0.77) responses to food intake. These findings may be informative for developing personalized diet strategies. The ClinicalTrials.gov registration identifier is NCT03479866.
Conflict of interest statement
Conflict of interest statement: TD Spector, SE Berry, AM Valdes, F Asnicar, PW Franks, LM Delahanty, N Segata, are consultants to Zoe Global Ltd (“Zoe”). J Wolf, G Hadjigeorgiou, R Davies, H Al Khatib, J Capdevila, C Bonnett, S Ganesh, E Bakker, P Wyatt and I Linenberg are or have been employees of Zoe. Other authors have no conflict of interest to declare.
Figures
Extended Data Figure 1.
Consort Diagrams for (a) UK and (b) US populations in the PREDICT 1 study.
Extended Data Figure 2.
Repeatability in the PREDICT 1 study
Extended Data Figure 3.
Frequency distribution of in-person ranking for 6 of meals shown in Figure 6a (High fat 40g = meal 7, High protein = meal 8, UK average = meal 2, High carb = meal 4, OGTT = meal 5, Uk avg at lunch = meal 2). n = 1102 participants
Extended Data Figure 4.
Machine Learning comparisons, cross validation and repeatability
Figure 1.. Experimental design.
The PREDICT 1 study comprised a primary UK-based cohort (nmax = 1,002) and an independent US-based validation cohort (nmax = 100).
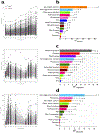
Figure 2.. Variation in postprandial responses.
a. Inter-individual variation in triglyceride, glucose and insulin postprandial responses to the breakfast and lunch meal challenges in the clinic (n = 1002). b. Determinants of triglyceride6h-rise measured from DBS (comparison of meals 1 and 7). c. Determinants of glucoseiAUC0-2h measured by CGM (comparison of 7 test meals; 1, 2, 4, 5, 6, 7 and 8). d. Determinants of C-peptide1h-rise measured from DBS as a proxy for insulin (comparison of meals 2 and 3). Trait variations explained for each input variable are derived from separate (non-hierarchical) regression models. Values represent adjusted-R2 and error bars reflect 95% confidence intervals. Meal composition and Meal context adjusted-R2 values were derived from meal sample sizes as follows; triglyceride6h-rise, n = 712; glucoseiAUC0-2h, n = 9102; C-peptide1h-rise, n = 186. All other determinant values were derived from meal sample sizes as follows; triglyceride6h-rise, n = 920; glucoseiAUC0-2h, n = 958; C-peptide1h-rise, n = 960. TG = triglyceride, DBS = dried blood spots, CGM = continuous glucose monitor. * p<0.05, ** p<0.01, *** p<0.001 using multivariable linear regression.
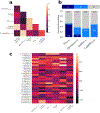
Figure 3.. Relationship of baseline values, genetic and microbiome factors to postprandial responses.
a. Pearson correlations between baseline values and postprandial prediction measures of 980 participants from the UK cohort. b. Heritability of postprandial responses (the ACE model was fitted on log-scaled postprandial responses for triglyceride, glucose, insulin and C-peptide) in 183 MZ and 47 DZ twin pairs. A; additive genetic component, C; shared environmental component, E; individual environmental component. c. SNP associations with postprandial measures focusing on SNPs identified in published postprandial trait GWAS– (n = 241; * p<0.05, *** p<0.001, using two-sided chi-squared test).
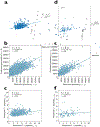
Figure 4 -. Machine learning models fitted in to postprandial measures.
a. Machine learning model for TG6h-rise in the UK cohort. b. Machine learning model for glucoseiAUC0-2h in the UK cohort. c. Machine learning model for C-peptide1h-rise postprandial responses in the UK cohort. The machine learning models in the US validation cohort are shown in Figures 4 d-f. The relationship between variables is expressed as Pearson’s correlation coefficient (r) and denoted with a regression line; n represents participant number; the features used to predict each value are the same as those listed in the linear models in Figure 2b–d.
Figure 5.. Associations between fasting and postprandial values for TG, C-peptide and glucose concentrations with clinical measures in the UK cohort.
Receiver operator characteristics curves illustrating the predictive utility of fasting and postprandial TG, glucose and C-peptide measures to discriminate the bottom 70% from the top 30% of the cohort (cut-off ASCVD 10 year risk of 0.0183) for a. atherosclerotic cardiovascular disease (ASCVD) 10-year risk n = 951 independent samples from the UK and b. impaired glucose tolerance (IGT) n = 826 independent samples from the UK. The same analyses were performed in the US cohort (n = 92 independent samples) resulting in ROC AUC (95%CI) values for ASCVD 10 year risk of: C-peptide fasting AUC = 0.68 (0.56–0.80), postprandial AUC = 0.66 (0.54–0.77), both AUC = 0.69 (0.58–0.81); TG fasting AUC = 0.73(0.63–0.84), postprandial AUC = 0.75 (0.65–0.85), both AUC = 0.77 (0.67–0.88); and glucose fasting AUC = 0.74-(0.63–0.85), postprandial AUC = 0.64 (0.52–0.76), both AUC = 0.76 (0.64–0.85). For impaired glucose tolerance values were: C-peptide fasting AUC = 0.66 (0.53–0.80), postprandial AUC = 0.59 (0.46–0.72), both AUC = 0.67 (0.54–0.80); and Triglyceride fasting AUC = 0.66 (0.53–0.80), postprandial AUC = 0.59 (0.46–0.72), both AUC = 0.61 (0.54–0.80).
Figure 6.. Person-specific diversity in postprandial response.
a. Proportion of times in the PREDICT 1 study that the ranking of the glycemic response (glucoseiAUC0-2h) to pairs of set meals was altered (n = 828, UK cohort). b. Effect size for factors explaining glycemic response. The different sources of variation were estimated using ANOVA, as described in Supplemental Table 3. The x-axis can be approximately interpreted as percent increase (or decrease) in iAUC attributable to the model parameters (n = 483 individuals) c. Time of day effects. (n = 920, UK cohort). Boxes show quartiles (25th, 50th, 75th percentiles); whiskers show the 95% interval.
Comment in
- Mapping postprandial responses sets the scene for targeted dietary advice.
Brand-Miller J, Buyken A. Brand-Miller J, et al. Nat Med. 2020 Jun;26(6):828-830. doi: 10.1038/s41591-020-0909-1. Nat Med. 2020. PMID: 32528152 No abstract available. - Towards precision nutrition.
Greenhill C. Greenhill C. Nat Rev Endocrinol. 2020 Sep;16(9):473. doi: 10.1038/s41574-020-0385-1. Nat Rev Endocrinol. 2020. PMID: 32591751 No abstract available.
Similar articles
- Postprandial glucose, insulin and incretin responses differ by test meal macronutrient ingestion sequence (PATTERN study).
Sun L, Goh HJ, Govindharajulu P, Leow MK, Henry CJ. Sun L, et al. Clin Nutr. 2020 Mar;39(3):950-957. doi: 10.1016/j.clnu.2019.04.001. Epub 2019 Apr 27. Clin Nutr. 2020. PMID: 31053510 Clinical Trial. - Effect of macronutrients and fiber on postprandial glycemic responses and meal glycemic index and glycemic load value determinations.
Meng H, Matthan NR, Ausman LM, Lichtenstein AH. Meng H, et al. Am J Clin Nutr. 2017 Apr;105(4):842-853. doi: 10.3945/ajcn.116.144162. Epub 2017 Feb 15. Am J Clin Nutr. 2017. PMID: 28202475 Free PMC article. Clinical Trial. - Postprandial platelet aggregation: effects of different meals and glycemic index.
Ahuja KD, Thomas GA, Adams MJ, Ball MJ. Ahuja KD, et al. Eur J Clin Nutr. 2012 Jun;66(6):722-6. doi: 10.1038/ejcn.2012.28. Epub 2012 Mar 21. Eur J Clin Nutr. 2012. PMID: 22434051 Clinical Trial. - The Future of Obesity Management through Precision Nutrition: Putting the Individual at the Center.
Ulusoy-Gezer HG, Rakıcıoğlu N. Ulusoy-Gezer HG, et al. Curr Nutr Rep. 2024 Sep;13(3):455-477. doi: 10.1007/s13668-024-00550-y. Epub 2024 May 28. Curr Nutr Rep. 2024. PMID: 38806863 Free PMC article. Review.
Cited by
- Examining the healthy human microbiome concept.
Joos R, Boucher K, Lavelle A, Arumugam M, Blaser MJ, Claesson MJ, Clarke G, Cotter PD, De Sordi L, Dominguez-Bello MG, Dutilh BE, Ehrlich SD, Ghosh TS, Hill C, Junot C, Lahti L, Lawley TD, Licht TR, Maguin E, Makhalanyane TP, Marchesi JR, Matthijnssens J, Raes J, Ravel J, Salonen A, Scanlan PD, Shkoporov A, Stanton C, Thiele I, Tolstoy I, Walter J, Yang B, Yutin N, Zhernakova A, Zwart H; Human Microbiome Action Consortium; Doré J, Ross RP. Joos R, et al. Nat Rev Microbiol. 2024 Oct 23. doi: 10.1038/s41579-024-01107-0. Online ahead of print. Nat Rev Microbiol. 2024. PMID: 39443812 Review. - The human gut microbiota and glucose metabolism: a scoping review of key bacteria and the potential role of SCFAs.
Palmnäs-Bédard MSA, Costabile G, Vetrani C, Åberg S, Hjalmarsson Y, Dicksved J, Riccardi G, Landberg R. Palmnäs-Bédard MSA, et al. Am J Clin Nutr. 2022 Oct 6;116(4):862-874. doi: 10.1093/ajcn/nqac217. Am J Clin Nutr. 2022. PMID: 36026526 Free PMC article. Review. - Common Misconceptions about Diet and Breast Cancer: An Unclear Issue to Dispel.
Lalioti A, Verzeletti L, Tiberio P, Gerosa R, Gaudio M, Saltalamacchia G, Pastore M, Zambelli A, Santoro A, De Sanctis R. Lalioti A, et al. Cancers (Basel). 2024 Jan 11;16(2):306. doi: 10.3390/cancers16020306. Cancers (Basel). 2024. PMID: 38254795 Free PMC article. Review. - Editorial: Personalized Nutrition.
Blaak EE, Roche HM, Afman LA. Blaak EE, et al. Front Nutr. 2021 Mar 25;8:669307. doi: 10.3389/fnut.2021.669307. eCollection 2021. Front Nutr. 2021. PMID: 33842527 Free PMC article. No abstract available. - Dynamic patterns of postprandial metabolic responses to three dietary challenges.
Weinisch P, Fiamoncini J, Schranner D, Raffler J, Skurk T, Rist MJ, Römisch-Margl W, Prehn C, Adamski J, Hauner H, Daniel H, Suhre K, Kastenmüller G. Weinisch P, et al. Front Nutr. 2022 Sep 22;9:933526. doi: 10.3389/fnut.2022.933526. eCollection 2022. Front Nutr. 2022. PMID: 36211489 Free PMC article.
References
- Agriculture, U.S.D.o.H.a.H.S.a.U.S.D.o. 2015 – 2020 Dietary Guidelines for Americans. 8th Edition. December 2015. Available at https://health.gov/our-work/food-and-nutrition/2015-2020-dietary-guideli...(2015).
- Karpyn A Food and public health : a practical introduction, xv, 368 pages (Oxford University Press, New York, 2018).
- (EFSA), E.F.S.A. Dietary Reference Values for nutrients Summary report. 10.2903/sp.efsa.2017.e15121(2017). - DOI
- Zeevi D et al. Personalized Nutrition by Prediction of Glycemic Responses. Cell 163, 1079–1094 (2015). - PubMed
Publication types
MeSH terms
Substances
Grants and funding
- MR/N01183X/1/MRC_/Medical Research Council/United Kingdom
- SP/14/8/31352/BHF_/British Heart Foundation/United Kingdom
- UL1 TR002541/TR/NCATS NIH HHS/United States
- DH_/Department of Health/United Kingdom
- MR/M016560/1/MRC_/Medical Research Council/United Kingdom
- BB/NO12739/1/BB_/Biotechnology and Biological Sciences Research Council/United Kingdom
- R01 CA230551/CA/NCI NIH HHS/United States
- WT_/Wellcome Trust/United Kingdom
- 212904/Z/18/Z/WT_/Wellcome Trust/United Kingdom
- U01 CA230551/CA/NCI NIH HHS/United States
LinkOut - more resources
Full Text Sources
Medical


