Partitioning of cancer therapeutics in nuclear condensates - PubMed (original) (raw)
. 2020 Jun 19;368(6497):1386-1392.
doi: 10.1126/science.aaz4427.
Ann Boija # 1, Lena K Afeyan 1 3, Susana Wilson Hawken 1 3, Mengyang Fan 4 5, Alessandra Dall'Agnese 1, Ozgur Oksuz 1, Jonathan E Henninger 1, Krishna Shrinivas 6 7, Benjamin R Sabari 1, Ido Sagi 1, Victoria E Clark 1 8, Jesse M Platt 1 9, Mrityunjoy Kar 10, Patrick M McCall 10 11 12, Alicia V Zamudio 1 3, John C Manteiga 1 3, Eliot L Coffey 1 3, Charles H Li 1 3, Nancy M Hannett 1, Yang Eric Guo 1, Tim-Michael Decker 13, Tong Ihn Lee 1, Tinghu Zhang 4 5, Jing-Ke Weng 1 3, Dylan J Taatjes 13, Arup Chakraborty 6 7 14 15 16 17 18, Phillip A Sharp 3 18, Young Tae Chang 19, Anthony A Hyman 11 20, Nathanael S Gray 4 5, Richard A Young 21
Affiliations
- PMID: 32554597
- PMCID: PMC7735713
- DOI: 10.1126/science.aaz4427
Partitioning of cancer therapeutics in nuclear condensates
Isaac A Klein et al. Science. 2020.
Abstract
The nucleus contains diverse phase-separated condensates that compartmentalize and concentrate biomolecules with distinct physicochemical properties. Here, we investigated whether condensates concentrate small-molecule cancer therapeutics such that their pharmacodynamic properties are altered. We found that antineoplastic drugs become concentrated in specific protein condensates in vitro and that this occurs through physicochemical properties independent of the drug target. This behavior was also observed in tumor cells, where drug partitioning influenced drug activity. Altering the properties of the condensate was found to affect the concentration and activity of drugs. These results suggest that selective partitioning and concentration of small molecules within condensates contributes to drug pharmacodynamics and that further understanding of this phenomenon may facilitate advances in disease therapy.
Copyright © 2020 The Authors, some rights reserved; exclusive licensee American Association for the Advancement of Science. No claim to original U.S. Government Works.
Figures
Fig. 1.
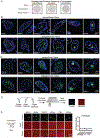
Nuclear condensates in human tissue and in vitro. (A) Model illustrating potential behaviors of small molecules in nuclear condensates. (B–C) Immunofluorescence of scaffold proteins of various nuclear condensates in tissue biopsies from benign and malignant human breast (B), and benign and malignant colon tissue (C), in nuclei stained with Hoechst, imaged at 100× on a fluorescent confocal microscope (see also Figures S1, S2). (D) Schematic of in vitro droplet formation assay to measure small molecule partitioning into nuclear condensates. (E) In vitro droplet assay showing the behavior of fluorescein dye in the presence of six protein condensates formed in 125mM NaCl and 10% PEG, with 10_μ_M protein and 5_μ_M fluorescein, imaged at 150× on a confocal fluorescent microscope (see also Figures S3–S6). Quantification of enrichment of the drug is shown to the right, error bars represent SEM.
Fig. 2.
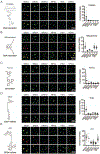
The partitioning behavior of small molecule drugs in nuclear condensates in a droplet assay. Six nuclear condensates formed in 125mM NaCl and 10% PEG, with 10_μ_M protein treated with either (A) 5_μ_M Cisplatin-TMR, (B) 50 _μ_M Mitoxantrone, (C) 100_μ_M FLTX1, (D) 5_μ_M THZ1-TMR, or (D) 1_μ_M JQ1-ROX imaged at 150× on a confocal fluorescent microscope (see also Figures S7–S11). Quantification of enrichment of the drug within droplets is shown to the right of each panel, error bars represent SEM (see also S12–S14).
Fig. 3.
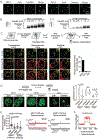
Small molecule concentration within condensates influences drug activity. (A) In vitro droplet assay of MED1 and HP1α condensates formed in 125mM NaCl and 10% PEG, 5nM of 450bp DNA, 10_μ_M MED1, and 5_μ_M cisplatin-TR, imaged at 150× on a confocal fluorescent microscope (see also Figure S15). (B) Bioanalyzer tracings of DNA contained within either MED1 or HP1α droplets exposed to the indicated concentration of cisplatin. (C) (Top) Schematic of an assay to determine the location of platinated DNA relative to various nuclear condensates. (Bottom) Co-immunofluorescence of platinated DNA and the indicated protein in HCT116 cells treated with 50_μ_M cisplatin for 6 hours. Imaged at 100× on a confocal fluorescent microscope. Quantification of overlap shown to the right. (D) (Top) Schematic of a live cell condensate dissolution assay. (Bottom) HCT116 cells bearing endogenously mEGFP-tagged MED1, HP1α, or FIB1 treated with 50_μ_M cisplatin for 12 hours. Quantification of MED1, HP1α, or FIB1 condensate score is shown to the right. (E) MED1 ChIP-seq in HCT116 cells treated with vehicle or 50_μ_M cisplatin for 6 hours. (Left) Plotted are mean read density of MED1 at super-enhancers and typical-enhancers (error bars show min and max) and (Right) gene tracks of MED1 ChIP-Seq at the MYC super-enhancer and AQPEP typical-enhancer. (F) Metaplot of cisplatin-DNA-Seq in cisplatin treated Hela cells comparing super-enhancers and typical enhancers (41) (see also Figures S16–S21).
Fig. 4.
Tamoxifen action and resistance in MED1 condensates. (A) Schematic showing tamoxifen resistance by ER mutation and MED1 overexpression in breast cancer. (B) In vitro droplets assay of the indicated form of GFP-tagged ER in the presence of estrogen, +/− 100_μ_M tamoxifen. Droplets are formed in 125mM NaCl and 10% PEG with 10_μ_M each protein and 100_μ_M estrogen. (C) (Left) Immunofluorescence of MED1 in tamoxifen sensitive (MCF7) and resistant (TAMR7) ER+ breast cancer cell lines imaged at 100× on a confocal fluorescent microscope. (Top right) Quantification of MED1 condensate size in breast cancer cells. (Bottom right) Relative quantities of MED1 in the indicated breast cancer cell line by western blot, error bars show SEM. (D) In vitro droplets assays of ER in the presence of 100_μ_M estrogen, +/− 100_μ_M tamoxifen with either 5_μ_M (Low) or 20_μ_M (High) MED1. Droplets are formed with 5_μ_M ER in 125mM NaCl and 10% PEG, imaged at 150× on a confocal fluorescent microscope, error bars are SEM. (E) In vitro droplet assay with either 5_μ_M (Low) or 20_μ_M (High) MED1 with 100_μ_M FLTX1 in 125mM NaCl and 10% PEG, error bars are SD. (F) Models for tamoxifen resistance due to altered drug affinity (via ER mutation) or concentration (via MED1 overexpression) (see also Figures S22–S30).
Comment in
- Drug modulation by nuclear condensates.
Viny AD, Levine RL. Viny AD, et al. Science. 2020 Jun 19;368(6497):1314-1315. doi: 10.1126/science.abc5318. Science. 2020. PMID: 32554584 Free PMC article. No abstract available. - Drugs enter a liquid phase.
Strzyz P. Strzyz P. Nat Rev Mol Cell Biol. 2020 Aug;21(8):419. doi: 10.1038/s41580-020-0268-2. Nat Rev Mol Cell Biol. 2020. PMID: 32601401 No abstract available. - Partitioning of Chemotherapeutics into Nuclear Condensates-Opening the Door to New Approaches for Drug Development.
Howard TP, Roberts CWM. Howard TP, et al. Mol Cell. 2020 Aug 20;79(4):544-545. doi: 10.1016/j.molcel.2020.07.029. Mol Cell. 2020. PMID: 32822580 - Understanding the phase separation characteristics of nucleocapsid protein provides a new therapeutic opportunity against SARS-CoV-2.
Zhao D, Xu W, Zhang X, Wang X, Ge Y, Yuan E, Xiong Y, Wu S, Li S, Wu N, Tian T, Feng X, Shu H, Lang P, Li J, Zhu F, Shen X, Li H, Li P, Zeng J. Zhao D, et al. Protein Cell. 2021 Sep;12(9):734-740. doi: 10.1007/s13238-021-00832-z. Epub 2021 Mar 26. Protein Cell. 2021. PMID: 33770364 Free PMC article. No abstract available.
Similar articles
- Coactivator condensation at super-enhancers links phase separation and gene control.
Sabari BR, Dall'Agnese A, Boija A, Klein IA, Coffey EL, Shrinivas K, Abraham BJ, Hannett NM, Zamudio AV, Manteiga JC, Li CH, Guo YE, Day DS, Schuijers J, Vasile E, Malik S, Hnisz D, Lee TI, Cisse II, Roeder RG, Sharp PA, Chakraborty AK, Young RA. Sabari BR, et al. Science. 2018 Jul 27;361(6400):eaar3958. doi: 10.1126/science.aar3958. Epub 2018 Jun 21. Science. 2018. PMID: 29930091 Free PMC article. - Nuclear condensates of the Polycomb protein chromobox 2 (CBX2) assemble through phase separation.
Tatavosian R, Kent S, Brown K, Yao T, Duc HN, Huynh TN, Zhen CY, Ma B, Wang H, Ren X. Tatavosian R, et al. J Biol Chem. 2019 Feb 1;294(5):1451-1463. doi: 10.1074/jbc.RA118.006620. Epub 2018 Dec 4. J Biol Chem. 2019. PMID: 30514760 Free PMC article. - CTCF-mediated chromatin looping provides a topological framework for the formation of phase-separated transcriptional condensates.
Lee R, Kang MK, Kim YJ, Yang B, Shim H, Kim S, Kim K, Yang CM, Min BG, Jung WJ, Lee EC, Joo JS, Park G, Cho WK, Kim HP. Lee R, et al. Nucleic Acids Res. 2022 Jan 11;50(1):207-226. doi: 10.1093/nar/gkab1242. Nucleic Acids Res. 2022. PMID: 34931241 Free PMC article. - Biomolecular Condensates in the Nucleus.
Sabari BR, Dall'Agnese A, Young RA. Sabari BR, et al. Trends Biochem Sci. 2020 Nov;45(11):961-977. doi: 10.1016/j.tibs.2020.06.007. Epub 2020 Jul 17. Trends Biochem Sci. 2020. PMID: 32684431 Free PMC article. Review. - Nuclear Protein Condensates and Their Properties in Regulation of Gene Expression.
Li W, Jiang H. Li W, et al. J Mol Biol. 2022 Jan 15;434(1):167151. doi: 10.1016/j.jmb.2021.167151. Epub 2021 Jul 14. J Mol Biol. 2022. PMID: 34271007 Free PMC article. Review.
Cited by
- Active RNA synthesis patterns nuclear condensates.
Banani SF, Goychuk A, Natarajan P, Zheng MM, Dall'Agnese G, Henninger JE, Kardar M, Young RA, Chakraborty AK. Banani SF, et al. bioRxiv [Preprint]. 2024 Oct 13:2024.10.12.614958. doi: 10.1101/2024.10.12.614958. bioRxiv. 2024. PMID: 39498261 Free PMC article. Preprint. - LncRNAs divide and rule: The master regulators of phase separation.
Somasundaram K, Gupta B, Jain N, Jana S. Somasundaram K, et al. Front Genet. 2022 Aug 10;13:930792. doi: 10.3389/fgene.2022.930792. eCollection 2022. Front Genet. 2022. PMID: 36035193 Free PMC article. Review. - Preserving condensate structure and composition by lowering sequence complexity.
Sood A, Zhang B. Sood A, et al. bioRxiv [Preprint]. 2023 Nov 29:2023.11.29.569249. doi: 10.1101/2023.11.29.569249. bioRxiv. 2023. PMID: 38076908 Free PMC article. Updated. Preprint. - β-synuclein regulates the phase transitions and amyloid conversion of α-synuclein.
Li X, Yu L, Liu X, Shi T, Zhang Y, Xiao Y, Wang C, Song L, Li N, Liu X, Chen Y, Petersen RB, Cheng X, Xue W, Yu YV, Xu L, Zheng L, Chen H, Huang K. Li X, et al. Nat Commun. 2024 Oct 9;15(1):8748. doi: 10.1038/s41467-024-53086-8. Nat Commun. 2024. PMID: 39384788 Free PMC article. - Epigenetic-Mediated Regulation of Gene Expression for Biological Control and Cancer: Cell and Tissue Structure, Function, and Phenotype.
Fritz AJ, El Dika M, Toor RH, Rodriguez PD, Foley SJ, Ullah R, Nie D, Banerjee B, Lohese D, Tracy KM, Glass KC, Frietze S, Ghule PN, Heath JL, Imbalzano AN, van Wijnen A, Gordon J, Lian JB, Stein JL, Stein GS. Fritz AJ, et al. Results Probl Cell Differ. 2022;70:339-373. doi: 10.1007/978-3-031-06573-6_12. Results Probl Cell Differ. 2022. PMID: 36348114 Free PMC article. Review.
References
- Shin Y, Brangwynne CP, Liquid phase condensation in cell physiology and disease. Science (80-.) 357, eaaf4382 (2017). - PubMed
- Hyman AA, Weber CA, Jülicher F, Liquid-Liquid Phase Separation in Biology. Annu. Rev. Cell Dev. Biol 30, 39–58 (2014). - PubMed
- Langdon EM, Gladfelter AS, A New Lens for RNA Localization: Liquid-Liquid Phase Separation. Annu. Rev. Microbiol 72, 255–271 (2018). - PubMed
Publication types
MeSH terms
Substances
Grants and funding
- R01 GM123511/GM/NIGMS NIH HHS/United States
- R01 GM117370/GM/NIGMS NIH HHS/United States
- T32 GM007287/GM/NIGMS NIH HHS/United States
- T32 DK007191/DK/NIDDK NIH HHS/United States
- P01 CA155258/CA/NCI NIH HHS/United States
- T32 GM087237/GM/NIGMS NIH HHS/United States
- R01 GM034277/GM/NIGMS NIH HHS/United States
- U01 CA213333/CA/NCI NIH HHS/United States
- R01 HG002668/HG/NHGRI NIH HHS/United States
LinkOut - more resources
Full Text Sources
Other Literature Sources


