Interferon regulatory factor 1 regulates PANoptosis to prevent colorectal cancer - PubMed (original) (raw)
Interferon regulatory factor 1 regulates PANoptosis to prevent colorectal cancer
Rajendra Karki et al. JCI Insight. 2020.
Abstract
Interferon regulatory factor 1 (IRF1) regulates diverse biological functions, including modulation of cellular responses involved in tumorigenesis. Genetic mutations and altered IRF1 function are associated with several cancers. Although the function of IRF1 in the immunobiology of cancer is emerging, IRF1-specific mechanisms regulating tumorigenesis and tissue homeostasis in vivo are not clear. Here, we found that mice lacking IRF1 were hypersusceptible to colorectal tumorigenesis. IRF1 functions in both the myeloid and epithelial compartments to confer protection against AOM/DSS-induced colorectal tumorigenesis. We further found that IRF1 also prevents tumorigenesis in a spontaneous mouse model of colorectal cancer. The attenuated cell death in the colons of Irf1-/- mice was due to defective pyroptosis, apoptosis, and necroptosis (PANoptosis). IRF1 does not regulate inflammation and the inflammasome in the colon. Overall, our study identified IRF1 as an upstream regulator of PANoptosis to induce cell death during colitis-associated tumorigenesis.
Keywords: Cancer; Colorectal cancer; Immunology; Innate immunity; Oncology.
Conflict of interest statement
Conflict of interest: The authors have declared that no conflict of interest exists.
Figures
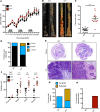
Figure 1. IRF1 prevents colitis-associated colorectal tumorigenesis.
(A) Body weight change of WT (n = 10) and _Irf1_–/– (n = 10) mice from 1 experiment (representative of 3 independent experiments). (B) Representative images of colon tumors in WT and _Irf1_–/– mice 80 days after injection of azoxymethane (AOM). (C) Number of colon tumors in WT (n = 14) and _Irf1_–/– (n = 12) mice. (D) Percentage of tumors of various sizes 80 days after AOM injection. (E) Representative H&E staining of colon tumors. Scale bar: 200 μM. (F) Histological scores 80 days after injection of AOM. (G) Percentage of mice with dysplasia 80 days after AOM injection. (H) Percentage of mice with adenocarcinoma 80 days after AOM injection. Data are from 1 experiment (representative of 3 independent experiments). Each symbol represents 1 individual mouse (C and F). ***P < 0.001; ****P < 0.0001. The 2-tailed t test (C) and 2-way ANOVA (F) were used. Data are represented as mean ± SEM.
Figure 2. IRF1 functions in both the myeloid and epithelial cell to prevent colitis-associated colorectal tumorigenesis.
(A) Representative images of colon tumors in WT, LysM_Cre_Irf1fl/fl, Villin_Cre_Irf1fl/fl, and _Irf1_–/– mice 80 days after azoxymethane (AOM) injection. (B) Number of colon tumors in WT (n = 10), LysM_Cre_Irf1fl/fl (n = 10), Villin_Cre_Irf1fl/fl (n = 10), and _Irf1_–/– (n = 7) mice. (C) Percentage of tumors of various sizes in WT, LysM_Cre_Irf1fl/fl, Villin_Cre_Irf1fl/fl, and _Irf1_–/– mice 80 days after AOM injection. (D) Body weight change in WT, LysM_Cre_Irf1fl/fl, Villin_Cre_Irf1fl/fl, and _Irf1_–/– mice 80 days after AOM injection. Each symbol represents 1 individual mouse in B. *P < 0.01; ****P < 0.0001. One-way ANOVA (B) was used. Data are representative of 2 independent experiments. Data are represented as mean ± SEM.
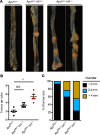
Figure 3. IRF1 prevents colorectal cancer in an _Apc_Min/+ model of tumorigenesis.
(A) Representative images of colon tumors in 120-day-old littermate _Apc_Min/+, _Apc_Min/+Irf1+/-, and _Apc_Min/+Irf1−/− mice. (B) Number of colon tumors in 120-day-old littermate Apc_Min/+ (n = 5), Apc_Min/+Irf1+/– (n = 5), and _Apc_Min/+Irf1−/− (n = 5) mice. (C) Percentage of tumors of various sizes in 120-day-old littermate _Apc_Min/+, _Apc_Min/+Irf1+/–, and _Apc_Min/+Irf1−/− mice. Each symbol represents 1 individual mouse in B. **P < 0.01. One-way ANOVA (B) was used. Data are represented as mean ± SEM.
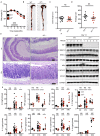
Figure 4. IRF1 does not regulate inflammation in the colon.
(A) Body weight change of WT (n = 10) and _Irf1_–/– (n = 10) mice from 1 experiment (representative of 3 independent experiments). (B and C) Representative images of colon (B) and length of colon (C) in WT (n = 10) and _Irf1_–/– (n = 10) mice 14 days after azoxymethane (AOM) injection. (D) Histological scores. (E) Representative H&E staining of colon. Scale bar: 500 μM. (F) Immunoblot analysis of IRF1, phosphorylated and total ERK1 and ERK2 (P-ERK1/2 and ERK1/2, respectively), phosphorylated and total IκBα (P-IκBα and IκBα, respectively), phosphorylated and total STAT3 (P-STAT3 and STAT3, respectively), and GAPDH (loading control) in colons of WT and _Irf1_–/– mice. Blots represent data from the same biological samples run in parallel. (G) Levels of inflammatory cytokines in the colons of WT and _Irf1_–/– mice at day 0, 14, and 80 after AOM injection. Each symbol represents 1 individual mouse (C, D, and G). *P < 0.05; **P < 0.01; ****P < 0.0001. The 2-tailed t test (C and D) or 1-way ANOVA (G) were used. Data are from 1 experiment (representative of 3 independent experiments) (A–F) or pooled from 2 independent experiments (G). Data are represented as mean ± SEM.
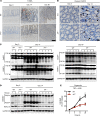
Figure 5. IRF1 regulates PANoptosis.
(A) Representative images of TUNEL staining of colons from azoxymethane/dextran sulfate sodium–treated (AOM/DSS-treated) WT and _Irf1_–/– mice on days 0, 14, and 80. (B) Representative images of cleaved caspase-3 (CASP3) staining of colon tissues from DSS-treated WT and _Irf1_–/– mice on days 0 and 14 after AOM injection. Scale bar: 100 μM. (C) Immunoblot analysis of the pro- and cleaved forms of CASP3 and caspase-7 (CASP7) in colons of WT and _Irf1_–/– mice on days 0, 14, and 80 after AOM injection. Blots represent data from the same biological samples at the indicated time point run in parallel. (D) Immunoblot analysis of GSDMD and MLKL in colons of WT and _Irf1_–/– mice 14 days after AOM injection. Blots represent data from the same biological samples run in parallel. (E) Cell death analysis of intestinal organoids derived from WT and _Irf1_–/– mice after stimulation with TNF + zVAD. **P < 0.01; ***P < 0.001. The 2-tailed t test (E) was used. Data are representative of 3 independent experiments. Data are represented as mean ± SEM.
Similar articles
- Immune regulator IRF1 contributes to ZBP1-, AIM2-, RIPK1-, and NLRP12-PANoptosome activation and inflammatory cell death (PANoptosis).
Sharma BR, Karki R, Rajesh Y, Kanneganti TD. Sharma BR, et al. J Biol Chem. 2023 Sep;299(9):105141. doi: 10.1016/j.jbc.2023.105141. Epub 2023 Aug 7. J Biol Chem. 2023. PMID: 37557956 Free PMC article. - Inactivation of Interferon Regulatory Factor 1 Causes Susceptibility to Colitis-Associated Colorectal Cancer.
Jeyakumar T, Fodil N, Van Der Kraak L, Meunier C, Cayrol R, McGregor K, Langlais D, Greenwood CMT, Beauchemin N, Gros P. Jeyakumar T, et al. Sci Rep. 2019 Dec 11;9(1):18897. doi: 10.1038/s41598-019-55378-2. Sci Rep. 2019. PMID: 31827213 Free PMC article. - IRF1 and IL1A associated with PANoptosis serve as potential immune signatures for lung ischemia reperfusion injury following lung transplantation.
Zhang N, Zhang Q, Zhang Z, Yu J, Fu Y, Gao J, Jiang X, Jiang P, Wen Z. Zhang N, et al. Int Immunopharmacol. 2024 Sep 30;139:112739. doi: 10.1016/j.intimp.2024.112739. Epub 2024 Jul 28. Int Immunopharmacol. 2024. PMID: 39074415 - Inflammasomes in Colitis and Colorectal Cancer: Mechanism of Action and Therapies.
Pandey A, Shen C, Man SM. Pandey A, et al. Yale J Biol Med. 2019 Sep 20;92(3):481-498. eCollection 2019 Sep. Yale J Biol Med. 2019. PMID: 31543710 Free PMC article. Review.
Cited by
- PANoptosis: A Unique Innate Immune Inflammatory Cell Death Modality.
Pandian N, Kanneganti TD. Pandian N, et al. J Immunol. 2022 Nov 1;209(9):1625-1633. doi: 10.4049/jimmunol.2200508. J Immunol. 2022. PMID: 36253067 Free PMC article. Review. - Coexistence of apoptosis, pyroptosis, and necroptosis pathways in celiac disease.
Ruera CN, Perez F, Iribarren ML, Guzman L, Menendez L, Garbi L, Chirdo FG. Ruera CN, et al. Clin Exp Immunol. 2023 Dec 13;214(3):328-340. doi: 10.1093/cei/uxad082. Clin Exp Immunol. 2023. PMID: 37455655 Free PMC article. - Identification of PANoptosis associated lncRNAs associated with clinical prognosis and immune infiltration microenvironment in colon adenocarcinoma.
Wang Y, Zhao S, Du S, Xia T, Song L, Xia M, Zhang B. Wang Y, et al. Discov Oncol. 2025 Jan 24;16(1):83. doi: 10.1007/s12672-025-01838-3. Discov Oncol. 2025. PMID: 39853491 Free PMC article. - Induction of pyroptotic cell death as a potential tool for cancer treatment.
Faria SS, Fernando AJ, de Lima VCC, Rossi AG, de Carvalho JMA, Magalhães KG. Faria SS, et al. J Inflamm (Lond). 2022 Nov 14;19(1):19. doi: 10.1186/s12950-022-00316-9. J Inflamm (Lond). 2022. PMID: 36376979 Free PMC article. Review. - Defining PANoptosis: Biochemical and Mechanistic Evaluation of Innate Immune Cell Death Activation.
Tweedell RE, Hibler T, Kanneganti TD. Tweedell RE, et al. Curr Protoc. 2024 Jul;4(7):e1112. doi: 10.1002/cpz1.1112. Curr Protoc. 2024. PMID: 39073015 Free PMC article.
References
Publication types
MeSH terms
Substances
Grants and funding
- R01 AI101935/AI/NIAID NIH HHS/United States
- R01 AI124346/AI/NIAID NIH HHS/United States
- P30 CA021765/CA/NCI NIH HHS/United States
- R01 CA163507/CA/NCI NIH HHS/United States
- R37 AI101935/AI/NIAID NIH HHS/United States
- R01 AR056296/AR/NIAMS NIH HHS/United States
LinkOut - more resources
Full Text Sources
Medical
Molecular Biology Databases


