Senolytic CAR T cells reverse senescence-associated pathologies - PubMed (original) (raw)
. 2020 Jul;583(7814):127-132.
doi: 10.1038/s41586-020-2403-9. Epub 2020 Jun 17.
Judith Feucht # 3 4, Josef Leibold # 2, Yu-Jui Ho 2, Changyu Zhu 2, Direna Alonso-Curbelo 2, Jorge Mansilla-Soto 3 4, Jacob A Boyer 1 5, Xiang Li 2 6, Theodoros Giavridis 3 4, Amanda Kulick 5, Shauna Houlihan 2, Ellinor Peerschke 7, Scott L Friedman 8, Vladimir Ponomarev 9, Alessandra Piersigilli 10, Michel Sadelain 11 12, Scott W Lowe 13 14
Affiliations
- PMID: 32555459
- PMCID: PMC7583560
- DOI: 10.1038/s41586-020-2403-9
Senolytic CAR T cells reverse senescence-associated pathologies
Corina Amor et al. Nature. 2020 Jul.
Erratum in
- Author Correction: Senolytic CAR T cells reverse senescence-associated pathologies.
Amor C, Feucht J, Leibold J, Ho YJ, Zhu C, Alonso-Curbelo D, Mansilla-Soto J, Boyer JA, Li X, Giavridis T, Kulick A, Houlihan S, Peerschke E, Friedman SL, Ponomarev V, Piersigilli A, Sadelain M, Lowe SW. Amor C, et al. Nature. 2024 Mar;627(8004):E9. doi: 10.1038/s41586-024-07197-3. Nature. 2024. PMID: 38383793 No abstract available.
Abstract
Cellular senescence is characterized by stable cell-cycle arrest and a secretory program that modulates the tissue microenvironment1,2. Physiologically, senescence serves as a tumour-suppressive mechanism that prevents the expansion of premalignant cells3,4 and has a beneficial role in wound-healing responses5,6. Pathologically, the aberrant accumulation of senescent cells generates an inflammatory milieu that leads to chronic tissue damage and contributes to diseases such as liver and lung fibrosis, atherosclerosis, diabetes and osteoarthritis1,7. Accordingly, eliminating senescent cells from damaged tissues in mice ameliorates the symptoms of these pathologies and even promotes longevity1,2,8-10. Here we test the therapeutic concept that chimeric antigen receptor (CAR) T cells that target senescent cells can be effective senolytic agents. We identify the urokinase-type plasminogen activator receptor (uPAR)11 as a cell-surface protein that is broadly induced during senescence and show that uPAR-specific CAR T cells efficiently ablate senescent cells in vitro and in vivo. CAR T cells that target uPAR extend the survival of mice with lung adenocarcinoma that are treated with a senescence-inducing combination of drugs, and restore tissue homeostasis in mice in which liver fibrosis is induced chemically or by diet. These results establish the therapeutic potential of senolytic CAR T cells for senescence-associated diseases.
Conflict of interest statement
COMPETING INTERESTS
A patent application has been submitted based in part on results presented in this manuscript. C.A, J.F, J.L, M.S, S.W.L are listed as the inventors. J.F and M.S hold other unrelated patents on CAR technologies.
Figures
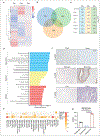
Extended Data Fig.1|. Genes coding for surface molecules commonly upregulated in senescence.
(a) Heatmap of genes upregulated upon therapy-induced senescence (TIS), oncogene-induced senescence (OIS) or p-53 induced senescence in hepatic stellate cells (HSCs). (b) Venn diagram displaying the number of common genes upregulated in the three databases shown in (a). (c) Log2 fold change of the eight commonly upregulated genes in the three different datasets shown in (a). (d) Combined enrichment score of significantly enriched gene sets among the 8 commonly upregulated genes in senescence. (e) Heatmap showing the expression profile of human uPAR (PLAUR) in human vital tissues as determined by the Human Proteome Map (HPM) compared to the expression profiles of other targets of CAR T cells in current clinical trials. (f) Immunohistochemical staining of murine uPAR (m.uPAR) in vital tissues of C57BL/6J mice. Representative results of 2 independent experiments. (g) Reads Per Kilobase (RPKM) of PLAUR mRNA in proliferating, quiescent (induced by serum starvation) or senescent (triggered by HRASG12V overexpression) human fibroblasts IMR-90. Results of 1 independent experiment with n=3 replicates for proliferating, quiescent and senescent conditions. Data represent mean± SEM. Two-tailed unpaired Student’s t-test.
Extended Data Fig.2|. uPAR is a cell surface and secreted biomarker of senescence.
(a-b) qRT-PCR of SASP gene expression in senescent versus proliferating (a) KRASG12D;p53−/− (KP) tumor cells or (b) human primary melanocytes and representative SA-β-Gal stainings. (c-e) Co-immunofluorescence stainings and quantifications of (c) m.uPAR (red) and ki-67 (green) or (d) m.uPAR (red) and IL6 (green) and (e) immunohistochemical staining of m.uPAR or P-ERK in serial sections in murine livers 6 days after hydrodynamic tail vein injection (HTVI) with a plasmid encoding NRASG12V. Representative results of 2 independent experiments (n=3 mice per group). (f-i) Mice expressing endogenous KRASG12D in pancreatic epithelial cells were treated with cerulean (Cr) and harvested 21 weeks afterwards when they had developed PanINs. Mice with normal pancreas (KRAS WT PBS) were used as controls. (f) Co-immunofluorescence staining of KATE (red) and m.uPAR (green). Representative results of 2 independent experiments (n=3 mice per group). (g) Levels of soluble uPAR (suPAR) in the mice shown in (f). Representative results of 2 independent experiments (n=2 mice per group). (h) Co-immunofluorescence stainings and quantifications of m.uPAR (red) and ki-67 (green). Representative results of 2 independent experiments (n=3 mice per group). (i) Representative SA-β-Gal staining. Representative results of 1 independent experiment (n=3 mice per group). (j-m) Mice were treated with either vehicle or CCl4 semiweekly for 6 weeks to induce liver fibrosis. (j) Fold change in the serum levels of suPAR. Representative results of 2 independent experiments (Vehicle: n=4, CCl4: n=9 mice per group). (k) Co-immunofluorescence staining and quantification of m.uPAR (red) and ki-67 (green). Representative results of 2 independent experiments (n=2 mice per group). (l) Co-immunofluorescence staining and quantification of m.uPAR (red) and IL-6 (green). Representative results of 2 independent experiments (n=3 mice per group). (m) Representative SA-β-Gal staining. Representative results of 2 independent experiments (n=3 mice per group). (j) Two-tailed unpaired Student’s t-test. Data represent mean± SEM (c,d,h,j,l).
Extended Data Fig.3|. uPAR is a marker of senescence in senescence-associated human pathologies.
(a) Immunohistochemical expression of human uPAR (h.uPAR) and SA-β-Gal in human samples of hepatitis-induced liver fibrosis (n=7 patients). Co-immunofluorescence staining and quantification of human uPAR (red) and p16 (green) or human uPAR (red) and IL6 (green) in human samples of hepatitis-induced liver fibrosis (n=3). (b) Immunohistchemical expression of human uPAR (h.uPAR) and SA-β-Gal in human samples from patients with eradicated hepatitis C virus (HCV) and residual liver fibrosis (n=7 patients). Co-immunofluorescence staining and quantification of human uPAR (red) and p16 (green) or human uPAR (red) and IL6 (green) in human samples of HCV-induced liver fibrosis (n=3). (c) Immunohistochemical stainings of human uPAR (h.uPAR) in human carotid endarterectomy samples (n= 5 patients). (d) Immunohistochemical stainings of human uPAR (h.uPAR) in human pancreas bearing pancreatic intraepithelial neoplasia (PanINs) compared to normal pancreas controls (n= 3 patients). (a,b) Data represent mean± SEM.
Extended Data Fig.4|. uPAR-28z CAR T cells selectively target uPAR positive cells.
(a) Construct maps encoding human m.uPAR-h.28z and h.CD19-h.28z CAR T cells or murine m.uPAR-m.28z and m.CD19-m.28z CARs. (b) Flow cytometric analysis showing expression levels of CAR and LNGFR for m.uPAR-h.28z and h.19-h.28z CAR T cells compared to untransduced (UT) T cells. Representative results of 4 independent experiments. (c) Flow cytometric analysis of murine uPAR and human CD19 expression on wild type NALM6 cells and on NALM6 cells overexpressing murine uPAR (NALM6-m.uPAR). Representative results of 3 independent experiments. (d) Cytotoxic activity of m.uPAR-h.28z, h.19-h.28z and untransduced (UT) T cells as determined by 4hr-Calcein assay with firefly luciferase (FFL)-expressing NALM6 WT or NALM6-m.uPAR as targets. Representative results of n=3 independent experiments performed in triplicates. Data are mean± SEM. (e) Granzyme B (GrB) and Interferon γ (IFNγ) expression on CD4+ and CD8+ m.uPAR-h.28z or h.19-h.28z CAR T cells 18 hours after co-culture with NALM6 WT, NALM6-m.uPAR or senescent KrasG12D;p53−/− (KP) cells as determined by intracellular cytokine staining. Results of n=1 independent experiment (no target: n=2, NALM6 WT: n=2, NALM6-m.uPAR: n=3 and KP senescent: n=3 replicates). Data are mean± SEM. (f) Experimental layout for Fig.2 (c-i): mice were injected with a plasmid encoding NRASG12V-GFP-Luciferase and treated with 0.5×10⁶ m.uPAR-h.28z CAR T cells or untransduced (UT) T cells 10 days after injection. Mice were euthanized 15 days after CAR administration and livers were used for further analysis. Images were created with
Biorender.com
. (g) Flow cytometric analysis of murine uPAR and CD19 on wild type (WT) Eμ-ALL01 cells and on Eμ-ALL01 cells overexpressing m.uPAR (Eμ-ALL01-m.uPAR). Representative results of 3 independent experiments. (h) Flow cytometric staining of Myc-tag and m.uPAR on m.uPAR-m.28z, m.CD19-m.28z and UT T cells as compared to FMO control. Representative results of 2 independent experiments.
Extended Data Fig.5|. Senolytic CAR T cells target senescent cells in a KrasG12D -driven model of lung cancer.
(a) Experimental layout: C57BL/6N mice were tail vein injected with 10.000 KrasG12D;p53−/− cells. Treatment with combined MEK (1mg/kg body weight) and Cdk4/6 inhibitors (100 mg/kg body weight) was initiated 7 days later, followed by adoptive transfer of 2×10⁶ CD45.1+ T cells (m.uPAR-m.28z CAR T cells, m.19-m.28z CAR T cells or untransduced (UT) T cells) one week later. A subset of mice received a second infusion of either 1×10⁶ m.uPAR-m.28z CAR T cells, m.19-m.28z CAR T cells or UT T cells 7 days after the first T cell injection. Images of the mouse, tumor cells and CAR T cells were created with
Biorender.com
. (b) Kaplan-Meier curve showing survival of mice and log-rank (Mantel Cox) test. Results of 2 independent experiments (UT: n=16, m.19-m.28z: n=14, m.uPAR-m.28z: n=18, UT reinjection: n=6, m.19-m.28z reinjection: n=7 and m.uPAR-m.28z reinjection: n=7 mice). (c-d) Weight (g) (c) and temperature (C) (d) as measured 24h before and at different time points after CAR T cell infusion. P values refer to the comparison between UT and m.uPAR-m.28z injected mice at 48h (weight: p=0.9329; temperature: p=0.1534). Results of 1 independent experiment (UT: n=5, m.19-m.28z: n=5, m.uPAR-m.28z: n=8, UT reinjection: n=5, m.19-m.28z reinjection: n=7 and m.uPAR-m.28z reinjection: n=7 mice). (e) Cell counts of CD45.1+ T cells and expression of activation markers CD25 or CD69 (UT: n=4, m.19-m.28z: n=5, m.uPAR-m.28z: n=5 mice) on CD45.1+ T cells in the lungs of mice 7 days after administration of m.uPAR-m.28z, m.19-m.28z or UT T cells. (f) Representative SA-β-Gal staining and quantification in the lungs of mice 7 days after treatment with m.uPAR-m.28z CAR T cells compared to mice treated with m.19-m.28z CAR T cells or UT T cells (n=3 mice per group). (b) Log-rank (Mantel Cox) test one-sided. (c-g) Data represent mean± SEM. Two-tailed unpaired Student’s t-test.
Extended Data Fig.6|. Senolytic CAR T cells show therapeutic activity in CCl4-induced liver fibrosis.
(a) Layout for experiments performed using the CCl4-induced liver fibrosis model: C57BL/6N mice received semiweekly intraperitoneal infusions of CCl4 for 6 weeks and were intravenously infused with 0.5–1×10⁶ (Fig. 3) or 2–3×10⁶ (Extended Data Fig. 6c-i) murine m.uPAR-m.28z CAR T cells, m.19-m.28z CAR T cells or untransduced (UT) T cells 16–24hr after cyclophosphamide (200mg/kg) administration. Mice were euthanized 20 days after CAR infusion to assess liver fibrosis. Images were created with
Biorender.com
. (b) Expression of GFP/click beetle red (CBR) luciferase and Myc-tag for m.uPAR-m.28z and m.19-m.28z CAR T cells used for T cell imaging experiments (Fig. 3g-h) as compared to control T cells. Representative results of 2 independent experiments. (c) Sirius red and SA-β-Gal staining and quantifications of livers from treated mice (n=6 mice per group). (d) Co-immunofluorescence of m.uPAR (red) and smooth muscle actin (green) or Myc-tag (red) and smooth muscle actin (green) in the livers of treated mice. (e) Fold change difference in serum levels of soluble (suPAR) 20 days after CAR T cell treatment as compared to day −1 before CAR T cell injection (UT: n=18 mice, m.19-m.28z: n=6, m.uPAR-m.28z: n=17). (f-g) Levels of serum alanine aminotransferase (ALT) (U/L) (f) and levels of serum aspartate aminotransferase (AST) (U/L) (g) 20 days after CAR treatment (UT: n=10 mice, m.19-m.28z: n=8, m.uPAR-m.28z: n=10). (h) Co-immunofluorescence staining of desmin (red) and ki-67 (green) in the livers of mice 15, 20 and 77 days after CAR T cell treatment. CCl4 treatment was stopped 20 days after T cell infusion (n=3 mice per group). (i) Mice were treated with CCl4 for 10 weeks. Sirius red staining of the livers of mice before (d.−1) and 20 days after T cell administration (UT: n=4 mice, m.uPAR-m.28z: n=2). (c-g) Representative results of 2 independent experiments. All data represent mean± SEM. (c, e-g) Two-tailed unpaired Student’s t-test.
Extended Data Fig.7|. Safety profile of m.uPAR-m.28z CAR T cells at therapeutic T cell doses.
(a)-(e) C57BL/6N mice received semiweekly intraperitoneal (ip) infusions of CCl4 for 6 weeks and were intravenously (iv) injected with 0.5–1×10⁶ murine m.uPAR-m.28z CAR T cells, 1×10⁶ murine m.19-m.28z CAR T cells or untransduced (UT) T cells 16hr after cyclophosphamide (200mg/kg) administration. Mice were euthanized 20 days after T cell administration to assess potential toxicities and lung histopathology. (a) Kaplan-Meier curve showing survival of mice after treatment with either m.uPAR-m.28z (n=16 mice), m.19-m.28z CAR T cells (n=6) or UT T cells (n=6). (b-c) Weight (g) shown in (b) and temperature (C) shown in (c) of mice as measured before and at different time points after T cell infusion (UT and m.19-m.28z: n=6 mice; m.uPAR-m28z: n=7). P value in (b) refers to differences in weight at 48h. (d-e) Representative hematoxylin and eosin (H&E) stainings of lungs (d) and complete blood counts (e) of treated mice 20 days after T cell infusion (UT and m.19-m.28z: n=3–4 mice; m.uPAR-m28z: n=4). Increased macrophage accumulation was observed in the immunodeficient setting. (a-e) Representative results of 1 independent experiment. All data represent mean± SEM. (b, e) Two-tailed unpaired Student’s t-test.
Extended Data Fig.8|. Safety profile of m.uPAR-m.28z CAR T cells at supratherapeutic T cell doses.
C57BL/6N mice received semiweekly intraperitoneal (ip) infusions of CCl4 for 6 weeks followed by intravenous (iv) infusion of 2–3×10⁶ murine m.uPAR-m.28z CAR T cells or untransduced (UT) T cells 16–24hr after cyclophosphamide (200mg/kg) administration. A subset of mice (as specified in the figures) received additional treatment with IL6R blocking antibodies (IL6Ri) and Anakinra (IL1Ri), starting 24h before T cell infusion and continued daily until 6 days after T cell infusion. Mice were euthanized 12 weeks after CAR infusion to assess potential toxicities. (a) Kaplan-Meier curve showing survival of mice after CAR T cell injection (UT: n=19 mice, UT + IL6Ri/IL1Ri: n=7, m.uPAR-m.28z: n=30, m.uPAR-m.28z + IL6Ri/IL1Ri: n=19). (b-c) Temperature (b) and weight (c) of treated mice (UT: n=7 mice, UT + IL6Ri/IL1Ri: n=8, m.uPAR-m.28z: n=11, m.uPAR-m.28z + IL6Ri/IL1Ri: n=10). (d) Weight (g) of mice 120h after infusion with either m.uPAR-m.28z or m.uPAR-m.28z and additional treatment with IL6Ri and IL1Ri (m.uPAR-m.28z: n=11, m.uPAR-m.28z + IL6Ri/IL1Ri: n=10). (e) Serum levels of murine IL-6, GM-CSF, G-CSF and IFNy in mice treated with either m.uPAR-m.28z or UT T cells 72h or 20 days after T cell infusion (UT: n=5, m.uPAR-m.28z: n=4 at 72h and n=5 at 20d). (f-g) Number of adoptively transferred CD45.1 positive T cells (f), macrophages, uPAR-positive and iNOS-positive macrophages (g) in the lungs of mice treated with m.uPAR-m.28z, m.19-m.28z or UT T cells alone or in combination with combined IL6Ri and ILR1i 3 days after T cell infusion (n=4 mice per group). (h-i) Numbers of macrophages (h) and uPAR positive macrophages (i) in lungs, liver, bone marrow (BM) and spleen of untreated mice or mice treated with either m.uPAR-m.28z or UT T cells 12 weeks after T cell infusion (n=3 mice per group). (a-e) Representative results of 3 independent experiments. All data represent mean± SEM. Two-tailed unpaired Student’s t-test. (f-i) Representative results of 1 independent experiment. All data represent mean± SEM. Two-tailed unpaired Student’s t-test.
Extended Data Fig.9|. Therapeutic intervention with IL6R and IL1R inhibitors does not decrease therapeutic efficacy of senolytic CAR T cells in CCl4-induced liver fibrosis.
(a) Experimental layout: C57BL/6N mice received semiweekly intraperitoneal (ip) infusions of CCl4 for 6 weeks and were intravenously (iv) infused with 2–3×10⁶ murine m.uPAR-m.28z CAR T cells or UT T cells 24hr after cyclophosphamide (200mg/kg) administration. IL6R blocking antibodies (IL6Ri) and Anakinra (ILRi) were first administered 24h before T cell infusion followed by daily (IIL6Ri) or twice a day (Anakinra) injections for the first 6 days until treatment was stopped. Mice were euthanized 20 days after T cell infusion to assess liver fibrosis. Images were created with
Biorender.com
. (b) Fold change difference in serum levels of soluble (suPAR) 20 days after CAR T cell treatment as compared to day −1 before CAR T cell injection (UT: n=4 mice, UT+IL6Ri/IL1Ri: n=8, m.uPAR: n=5, m.uPAR+IIL6Ri/IL1Ri: n=8). (c-d) Levels of serum alanine aminotransferase (ALT) (U/L) (c) and of serum aspartate aminotransferase (AST) (U/L) (d) in treated mice 20 days after T cell infusion (UT: n=3 mice, UT+IL6Ri/IL1Ri: n=5, m.uPAR-m.28z: n=5 (ALT) and n=3 (AST), m.uPAR-m.28z+IIL6Ri/IL1Ri: n=5). (e) Representative levels of fibrosis evaluated by Sirius red staining and SA-β-Gal staining of livers from treated mice and quantification of liver fibrosis and SA-β-Gal+ cells in the respective livers 20 days after treatment (UT: n=4 mice, UT+IL6Ri/IL1Ri: n=4, m.uPAR-m.28z: n=4, m.uPAR-m.28z+IIL6Ri/IL1Ri: n=5). (f) Co-immunofluorescence staining of either murine uPAR (red) and smooth muscle actin (green) or Myc-tag (red) and smooth muscle actin (green) in the livers of treated mice. (b,c,d,e,f) Representative results of 1 independent experiment. All data represent mean± SEM. Two-tailed unpaired Student’s t-test.
Extended Data Fig.10|. Safety profile of senolytic CAR T cells at therapeutic doses in a murine NASH-induced liver fibrosis model.
Immunohistochemical expression of murine uPAR in samples from the “STAM™” model, (n=3 mice). (b) Experimental layout for experiments performed using the model of diet-induced NASH (Fig. 4, Extended Data Fig. 10): C57BL/6N mice received normal chow or NASH diet for 3 months, followed by intravenous (iv) infusion with 0.5×10⁶ murine m.uPAR-m.28z CAR T cells or UT T cells 16 hours after cyclophosphamide (200mg/kg) administration. Mice were euthanized 20 days after CAR infusion to assess liver fibrosis. Images were created with
Biorender.com
. (c) Kaplan-Meier curve showing survival of mice after treatment with either m.uPAR-m.28z or UT T cells (m.uPAR-m.28z: n=16 mice and UT: n=10). (d-e) Weight (d) and temperature (e) of mice before and at different time points after T cell infusion (m.uPAR-m.28z: n=11 mice and UT: n=9). Data represent mean± SEM. (f) Representative H&E stainings of the lungs of treated mice (m.uPAR-m.28z: n=6 mice and UT: n=4). (c-f) Representative results of 2 independent experiments.
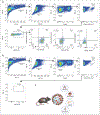
Extended Data Fig.11|. Gating strategies, summary and potential applications of senolytic CAR T cells.
(a)-(b) Representative flow cytometric staining of m.uPAR-h.28z CAR T cells (a) or untransduced T cells (b) obtained from the livers of mice that had undergone hydrodynamic tail vein injections (HTVI) (as depicted in Fig.2). Representative results of 1 independet experiment (n=4 mice per group). (c) Illustration summarizing key points of our findings. uPAR-28z CAR T cells (depicted in red) infiltrate fibrotic livers containing senescent cells (here depicted in blue) and efficiently eliminate them, leading to fibrosis resolution and improved liver function. The therapeutic action of senolytic uPAR-28z CAR T cells might be extended to other senescence-associated diseases such as lung fibrosis, atherosclerosis, diabetes or osteoarthritis. Images were created with
Biorender.com
.
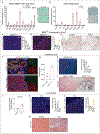
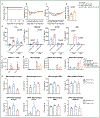
Figure 1|. uPAR is a cell surface and secreted biomarker of senescence.
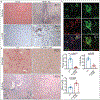
(a) Flow cytometric analysis of mouse uPAR (m.uPAR) expression on Kras G12D ;p53 −/− murine lung adenocarcinoma cells (KP) induced to senesce by treatment with MEK and CDK4/6 inhibitors as compared to controls. Representative results of n=3 independent experiments. Levels of soluble uPAR (suPAR) as determined by ELISA in the supernatant of senescent or proliferating KP cells. Representative results of n=2 independent experiments. (b) Flow cytometric analysis comparing human uPAR (h.uPAR) expression on primary human melanocytes induced to senesce by continuous passage with proliferating controls**.** Representative results of n=2 independent experiments. Levels of suPAR in the supernatant of senescent (Passage 15 = P.15) or proliferating (Passage 2 = P.2) primary human melanocytes. Representative results of n=2 independent experiments. (c) Immunohistochemical stainings of h.uPAR and SA-β-Gal of a patient-derived xenograft (PDX) from human lung adenocarcinoma orthotopically injected into NSG mice after treatment with vehicle or combined MEK and CDK4/6 inhibitors; representative of n=2 independent experiments (n=3 mice per group). (d) Co-immunofluorescence (IF) staining of m.uPAR (red) and NRAS (green) in the livers of mice 6 days after hydrodynamic tail vein injection of a plasmid encoding NRAS G12V or NRAS G12V;D38A. Representative results of n=3 independent experiments (n=5 mice per group). (e) Co-IF staining of m.uPAR (red) and smooth muscle actin (green) in the livers of mice 6 weeks after semi-weekly i.p. treatment with CCl4 (n=7 mice) or vehicle (n=4 mice). Representative results of n=3 independent experiments.
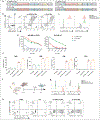
Figure 2|. uPAR-CAR T cells are bona fide senolytics.
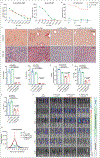
(a) Cytotoxic T cell activity as determined by a 18hr-bioluminescence assay with luciferase-expressing NALM6 wild type (WT) or NALM6 overexpressing m.uPAR (NALM6-m.uPAR) as targets. Data representative of n=3 independent experiments, each performed in triplicates. (b) Cytotoxic T cell activity as determined by a 4hr-bioluminescence assay with MEK/Cdk4/6 inhibitor-induced senescent KP cells as targets; representative of n=2 independent experiments, each performed in triplicates. (c-i) NSG mice were injected with a plasmid encoding NRAS _G12V_-GFP-Luciferase and treated with 0.5×10⁶ m.uPAR-h.28z CAR T cells or untransduced (UT) T cells 10 days after injection. Mice were euthanized 15 days later and livers were analyzed. (c) n fold change in luciferase signal in mice (calculated as average radiance on day 15 divided by average radiance on day −1) (n=11 mice per group). (d) Co-immunofluorescence (IF) staining of m.uPAR (red) and NRAS (green) and quantification of NRAS-positive cells (n=9 mice per group). (e) Representative stainings and quantification of SA-β-Gal positive cells (n=7 mice per group). (f) Co-IF staining of m.uPAR (red) and human CD3 (green) (n=5 mice per group). (g-i) Number of liver infiltrating T cells (g), expression of CD62L/CD45RA (h) and PD1+TIM3+LAG3+ (i) on m.uPAR-h.28z CAR T cells as determined by flow cytometry (n=4 mice per group). (c-e) Representative results of n=2 independent experiments. Data are mean± SEM. Two-tailed unpaired Student’s t-test.
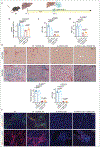
Figure 3|. Senolytic CAR T cells show therapeutic efficacy in CCl4-induced liver fibrosis.
(a) Cytotoxicity of murine CAR T cells as determined by a 18hr-bioluminescence assay with luciferase-expressing Eμ-ALL01 WT or Eμ-ALL01-m.uPAR as targets. Representative results of n=3 independent experiments, each performed in triplicates. (b) Cytotoxic activity as determined by a 18hr-bioluminescence assay using MEKi/CDK4/6i–treated KP cells as targets. Results of n=2 independent experiments, each performed in triplicates. (c-f) Mice with CCl4-induced liver fibrosis were treated with 0.5×10⁶ or 1×10⁶ m.uPAR-m.28z, 1×10⁶ m.19-m.28z or untransduced (UT) T cells and euthanized 20 days after. Livers were used for further analyses. (c) Representative levels of fibrosis as evaluated by Sirius red staining, SA-β-Gal expression and respective quantifications (UT and m.19-m.28z: n=3, m.uPAR-m.28z: n=4, m.uPAR-m.28z at 0.5×10⁶: n=5). (d-f) Fold change differences in serum levels of suPAR (d), AST (e) and ALT (f) 20 days after T cell infusion (UT, m.19-m.28z and m.uPAR-m.28z: n=3; m.uPAR-m.28z at 0.5×10⁶: n=5). (g)-(h) Mice with CCl4-induced liver fibrosis were injected with 0.5×10⁶ or 1×10⁶ click beetle red luciferase-expressing CAR T cells or UT T cells. (g) Luciferase signal (average radiance) of treated mice after T cell administration (UT and m.19-m.28z: n=3, m.uPAR-m.28z: n=4, m.uPAR-m.28z at 0.5×10⁶: n=3). (h) Representative bioluminescence images of mice at different time points after injection. Signal in control mice at day 10 indicates abdominal peritonitis induced by CCl4 injections as confirmed by pathology. (c-h) Results of n=1 independent experiment. Data are mean± SEM. Two-tailed unpaired Student’s t-test.
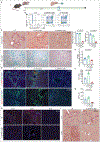
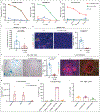
Figure 4|. Senolytic CAR T cells are therapeutic in NASH-induced liver fibrosis.
(a,b) Representative stainings in the livers of mice treated with chow or NASH diet for 3–4 months. (a) Immunohistochemical staining of m.uPAR and SA-β-Gal (n=3 mice per group) (b) Co-immunofluorescence staining of m.uPAR (green), desmin (red in left panel, gray in right panel) and F4/80 (red). Representative results of n=2 independent experiments (n=3 mice per group). (c-d) Mice treated with NASH diet for 3 months were injected with 0.5×10⁶ m.uPAR-m.28z CAR T cells or untransduced (UT) T cells. Liver and serum analyses were performed 20 days later. (c) Representative Sirius red staining, SA-β-Gal expression and quantifications (Sirius red: UT: n=9 mice, m.uPAR-m.28z: n=11. SA-β-Gal: UT: n= 4 mice, m.uPAR-m.28z: n=6). (d) Serum albumin levels (UT and m.uPAR-m.28z: n=6). (c-d) Results of n=2 independent experiments. Data are mean± SEM. Two-tailed unpaired Student’s t-test.
Comment in
- Driving CARs to clear senescent cells.
Crunkhorn S. Crunkhorn S. Nat Rev Drug Discov. 2020 Aug;19(8):509. doi: 10.1038/d41573-020-00117-w. Nat Rev Drug Discov. 2020. PMID: 32581354 No abstract available. - T cells engineered to target senescence.
Wagner V, Gil J. Wagner V, et al. Nature. 2020 Jul;583(7814):37-38. doi: 10.1038/d41586-020-01759-x. Nature. 2020. PMID: 32601490 No abstract available. - Use of CAR T cells as senolytic agents.
Carney EF. Carney EF. Nat Rev Nephrol. 2020 Sep;16(9):485. doi: 10.1038/s41581-020-0324-3. Nat Rev Nephrol. 2020. PMID: 32641759 No abstract available. - A Fresh Approach to Targeting Aging Cells: CAR-T Cells Enhance Senolytic Specificity.
Li JH, Chen YY. Li JH, et al. Cell Stem Cell. 2020 Aug 6;27(2):192-194. doi: 10.1016/j.stem.2020.07.010. Cell Stem Cell. 2020. PMID: 32763179 Free PMC article. - Step further towards targeted senolytic therapy: therapeutic potential of uPAR-CAR T cells for senescence-related diseases.
Huang Y, Liu T. Huang Y, et al. Signal Transduct Target Ther. 2020 Aug 13;5(1):155. doi: 10.1038/s41392-020-00268-7. Signal Transduct Target Ther. 2020. PMID: 32792494 Free PMC article. No abstract available. - Senolytic chimeric antigen receptor (CAR) T cell: driving the immune system to fight cell senescence.
Hajdu KL, Bonamino MH. Hajdu KL, et al. Immunol Cell Biol. 2020 Oct;98(9):709-711. doi: 10.1111/imcb.12391. Epub 2020 Aug 25. Immunol Cell Biol. 2020. PMID: 32842163 - Chimeric Antigen Receptor T Cells as Senolytic and Antifibrotic Therapy.
Ravichandra A, Filliol A, Schwabe RF. Ravichandra A, et al. Hepatology. 2021 Mar;73(3):1227-1229. doi: 10.1002/hep.31596. Epub 2021 Feb 21. Hepatology. 2021. PMID: 33058216 No abstract available.
Similar articles
- Phenotypes and ontogeny of senescent hepatic stellate cells in metabolic dysfunction-associated steatohepatitis.
Yashaswini CN, Qin T, Bhattacharya D, Amor C, Lowe S, Lujambio A, Wang S, Friedman SL. Yashaswini CN, et al. J Hepatol. 2024 Aug;81(2):207-217. doi: 10.1016/j.jhep.2024.03.014. Epub 2024 Mar 18. J Hepatol. 2024. PMID: 38508241 - NKG2D-CAR T cells eliminate senescent cells in aged mice and nonhuman primates.
Yang D, Sun B, Li S, Wei W, Liu X, Cui X, Zhang X, Liu N, Yan L, Deng Y, Zhao X. Yang D, et al. Sci Transl Med. 2023 Aug 16;15(709):eadd1951. doi: 10.1126/scitranslmed.add1951. Epub 2023 Aug 16. Sci Transl Med. 2023. PMID: 37585504 - Prophylactic and long-lasting efficacy of senolytic CAR T cells against age-related metabolic dysfunction.
Amor C, Fernández-Maestre I, Chowdhury S, Ho YJ, Nadella S, Graham C, Carrasco SE, Nnuji-John E, Feucht J, Hinterleitner C, Barthet VJA, Boyer JA, Mezzadra R, Wereski MG, Tuveson DA, Levine RL, Jones LW, Sadelain M, Lowe SW. Amor C, et al. Nat Aging. 2024 Mar;4(3):336-349. doi: 10.1038/s43587-023-00560-5. Epub 2024 Jan 24. Nat Aging. 2024. PMID: 38267706 Free PMC article. - Senolytic CAR T Cells in Solid Tumors and Age-Related Pathologies.
Feucht J, Abou-El-Enein M. Feucht J, et al. Mol Ther. 2020 Oct 7;28(10):2108-2110. doi: 10.1016/j.ymthe.2020.08.011. Epub 2020 Aug 25. Mol Ther. 2020. PMID: 32841587 Free PMC article. Review. No abstract available. - Harnessing Immune Rejuvenation: Advances in Overcoming T Cell Senescence and Exhaustion in Cancer Immunotherapy.
Admasu TD, Yu JS. Admasu TD, et al. Aging Cell. 2025 May;24(5):e70055. doi: 10.1111/acel.70055. Epub 2025 Apr 3. Aging Cell. 2025. PMID: 40178455 Free PMC article. Review.
Cited by
- Targeting cellular senescence in cancer and aging: roles of p53 and its isoforms.
Beck J, Turnquist C, Horikawa I, Harris C. Beck J, et al. Carcinogenesis. 2020 Aug 12;41(8):1017-1029. doi: 10.1093/carcin/bgaa071. Carcinogenesis. 2020. PMID: 32619002 Free PMC article. Review. - Role of Mesenchymal Stem/Stromal Cells (MSCs) and MSC-Derived Extracellular Vesicles (EVs) in Prevention of Telomere Length Shortening, Cellular Senescence, and Accelerated Biological Aging.
Arellano MYG, VanHeest M, Emmadi S, Abdul-Hafez A, Ibrahim SA, Thiruvenkataramani RP, Teleb RS, Omar H, Kesaraju T, Mohamed T, Madhukar BV, Omar SA. Arellano MYG, et al. Bioengineering (Basel). 2024 May 21;11(6):524. doi: 10.3390/bioengineering11060524. Bioengineering (Basel). 2024. PMID: 38927760 Free PMC article. Review. - ReCARving the future: bridging CAR T-cell therapy gaps with synthetic biology, engineering, and economic insights.
Ali A, DiPersio JF. Ali A, et al. Front Immunol. 2024 Sep 5;15:1432799. doi: 10.3389/fimmu.2024.1432799. eCollection 2024. Front Immunol. 2024. PMID: 39301026 Free PMC article. Review. - Targeting vascular senescence in cardiovascular disease with aging.
Hall SA, Lesniewski LA. Hall SA, et al. J Cardiovasc Aging. 2024 Apr;4(2):16. doi: 10.20517/jca.2023.45. Epub 2024 Feb 28. J Cardiovasc Aging. 2024. PMID: 39119148 Free PMC article. - Cellular senescence in brain aging and cognitive decline.
Shafqat A, Khan S, Omer MH, Niaz M, Albalkhi I, AlKattan K, Yaqinuddin A, Tchkonia T, Kirkland JL, Hashmi SK. Shafqat A, et al. Front Aging Neurosci. 2023 Nov 23;15:1281581. doi: 10.3389/fnagi.2023.1281581. eCollection 2023. Front Aging Neurosci. 2023. PMID: 38076538 Free PMC article. Review.
References
- Serrano M, Lin AW, McCurrach ME, Beach D & Lowe SW Oncogenic ras provokes premature cell senescence associated with accumulation of p53 and p16INK4a. Cell 88, 593–602 (1997). - PubMed
Publication types
MeSH terms
Substances
Grants and funding
- U54 OD020355/OD/NIH HHS/United States
- AG065396/AG/NIA NIH HHS/United States
- P30 CA008748/CA/NCI NIH HHS/United States
- R01 AG016379/AG/NIA NIH HHS/United States
- R56 AG016379/AG/NIA NIH HHS/United States
- P01 CA129243/CA/NCI NIH HHS/United States
- R01 AG065396/AG/NIA NIH HHS/United States
- U54 OD020355-01/CA/NCI NIH HHS/United States
- R01 DK056621/DK/NIDDK NIH HHS/United States
LinkOut - more resources
Full Text Sources
Other Literature Sources
Medical
Molecular Biology Databases
