Early and nonredundant functions of dynamin isoforms in clathrin-mediated endocytosis - PubMed (original) (raw)
Early and nonredundant functions of dynamin isoforms in clathrin-mediated endocytosis
Madhura Bhave et al. Mol Biol Cell. 2020.
Abstract
Dynamin GTPases (Dyn1 and Dyn2) are indispensable proteins of the core clathrin-mediated endocytosis (CME) machinery. Best known for their role in fission at the late stages of CME, many studies have suggested that dynamin also plays a regulatory role during the early stages of CME; however, detailed studies regarding isoform-specific early regulatory functions of the dynamins are lacking. With a recent understanding of the regulation of Dyn1 in nonneuronal cells and improved algorithms for highly sensitive and quantitative analysis of clathrin-coated pit (CCP) dynamics, we have evaluated the differential functions of dynamin isoforms in CME using domain swap chimeras. We report that Dyn1 and Dyn2 play nonredundant, early regulatory roles during CME in nonneuronal cells. The proline/arginine-rich domain of Dyn2 is important for its targeting to nascent and growing CCPs, whereas the membrane-binding and curvature-generating pleckstrin homology domain of Dyn1 plays an important role in stabilizing nascent CCPs. We confirm the enhanced ability of dephosphorylated Dyn1 to support CME, even at substoichiometric levels compared with Dyn2. Domain swap chimeras also revealed previously unknown functional differences in the GTPase and stalk domains. Our study significantly extends the current understanding of the regulatory roles played by dynamin isoforms during early stages of CME.
Figures
FIGURE 1:
Differential functions of dynamin isoforms in CME of nonneuronal cells. (A) A schematic representation of the domain structure and sequence identity of dynamin isoforms. (B) Effect of KD of dynamin isoforms on the efficiency of TfnR endocytosis in ARPE cells. The cells were treated with siRNAs as indicated and the efficiency of TfnR endocytosis was measured by in-cell ELISA assay and presented as the percentage of initial surface-bound TfnR. Data shown are average ± SD. (C) Quantification of surface accumulation of TfnR after KD of Dyn1, Dyn2, and Dyn1+2, as indicated (n = 3 independent biological repeats). (D) Effect on TfnR uptake efficiency in control and Dyn1+2 double KD cells with/without 30 min preincubation with chemicals affecting actin polymerization/depolymerization dynamics: latrunculin A (latA, 100 nM) and Jasp (1 µM). Statistical significance was calculated by t test. In this and subsequent figures, *p ≤ 0.05; **p ≤ 0.01; ***p ≤ 0.001; ****p ≤ 0.0001; n = 3 independent biological repeats. (E) ARPE cells expressing mRuby-CLCa and Tractin-eGFP were plated on gelatin-coated coverslips and imaged by TIRFM. Shown are the intensity profiles of the recruitment of Tractin-eGFP (secondary channel) to the indicated lifetime cohorts of mRuby-CLCa containing CCPs (primary channel). The TIRFM data are representative of two independent biological repeats.
FIGURE 2:
Differential regulation of CCP dynamics by dynamin isoforms. ARPE mRuby-CLCa live cell TIRFM data were analyzed by cmeAnalysis (A–F) or an intensity threshold independent DASC analysis algorithm (G, H). (A–D) Effect of dynamin isoform KD on (A) the rate of initiation of the subthreshold CSs. (B) The rate of initiation of CCPs above threshold. (C) The lifetime distribution of CCPs analyzed by cmeAnalysis, and (D) the proportion of the persistent CCPs; t test was used to calculate the statistical significance of cmeAnalysis data. (E, F) Intensity profiles of lifetime cohorts of mRuby-CLCa in (E) siCtrl vs. siDyn1 cells and (F) siCtrl vs. siDyn2 cells (G) Change in the percentage of CCPs calculated from DASC analysis. Dots represent raw data points from individual movies, box plots show mean as a red line with 95%, and 1 SD as pink and blue blocks, respectively. Wilcoxon rank-sum test was used to calculate the statistical significance of changes in CCP%. (H) Lifetime distribution of CCPs is defined by DASC analysis (number of traces analyzed by cmeAnalysis for siCtrl: 59682; siDyn1:51084; siDyn2: 34284; number of traces analyzed by DASC for siCtrl: 142050; siDyn1: 162768; siDyn2:102856). Data shown are representative of three independent biological repeats.
FIGURE 3:
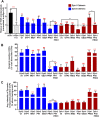
Domain swap chimeras reveal important functional differences between dynamin isoforms. (A) The ability of dynamin chimera to rescue TfnR uptake in the absence of endogenous Dyn1 and Dyn2 compared with residual TfnR uptake in Dyn1+2 double KD cells (indicated by the dashed line). Red asterisks indicate statistical significance of CME rescue by dynamin chimera when compared with residual CME in Dyn1+2 double KD cells; black asterisks denote statistical significance of CME rescue by dynamin chimera when compared with each other. Data shown are average ± SD (n = 3 independent biological repeats). (B) Quantification of the percentage of Dyn-positive CCPs from dual-color TIRFM images of mRuby-CLCa cells expressing eGFP fusions of dynamin domain swap chimera in the absence of endogenous Dyn1 and Dyn2. (C) Quantification of average Dyn-eGFP intensity in Dyn-positive CCPs from dual-channel TIRF images in the absence of endogenous Dyn1 and Dyn2. The number of CCPs analyzed in B and C is 18,000 CCPs from 40–50 cells/condition in single imaging experiment. For B and C, red asterisks indicate statistical significance when Dyn1 and Dyn2 chimera are compared with their respective wild-type controls. Black asterisks are used when two chimeras are compared with each other. Error bars represent SD; t test was used to analyze statistical significance.
FIGURE 4:
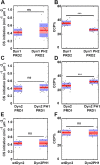
PH domains of dynamin isoforms play a differential role during CCP stabilization. DASC analysis of live cell TIRFM data from ARPE mRuby-CLCa cells stably overexpressing PH domain chimeras in the absence of endogenous Dyn1 and Dyn2. (A, C, E) Changes in the rate of initiation of all CSs. (B, D, F) Changes in the percentage of CCPs (CCP%). Dots represent raw data points from individual movies, box plots show mean as a red line with 95%, and 1 SD as pink and blue blocks, respectively. Wilcoxon rank-sum test was used to calculate statistical significance. The number of traces analyzed for above data (obtained from 1 experiment representive of 2–3 biological repeats) are: Dyn1PRD2-113430, Dyn1PH2PRD2-81527, Dyn2PRD1-114941, Dyn2PH1PRD1-162878, wtDyn2-69724, Dyn2PH1-65409.
FIGURE 5:
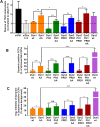
Constitutively activating PRD1 enhances CME efficiency as well as dynamin recruitment at CCPs. (A) The ability of wild-type and constitutively active (S774/778A) dynamin chimera to rescue TfnR uptake in the absence of endogenous Dyn1 and Dyn2. Data shown are average ± SD (n = 3 independent biological repeats). (B) Quantification of the percentage of Dyn-positive CCPs from dual-color TIRF images of mRuby-CLCa cells expressing eGFP fusions of wild-type or constitutively active dynamin domain swap chimera in the absence of endogenous Dyn1 and Dyn2. (C) Quantification of average Dyn-eGFP intensity in Dyn-positive CCPs from dual-channel TIRF images in the absence of endogenous Dyn1 and Dyn2. The number of CCPs analyzed in B and C is 19,000 CCPs from 40–50 cells/condition in single imaging experiment. The error bars represent SD; t test was used to calculate the statistical significance.
FIGURE 6:
Early recruitment of dynamin at CCPs correlates with successful CME. DASC analysis (A–C) or cmeAnalysis (D–F) results of live cell TIRFM data from ARPE mRuby-CLCa cells overexpressing the indicated eGFP-tagged dynamin isoforms in the absence of endogenous Dyn1 and Dyn2 compared with nonoverexpressing control cells (without KD of endogenous dynamins) (A) Changes in the rate of initiation of all clathrin-coated structures. (B) Change in the percentage of CCPs. Wilcoxon rank-sum test was used to calculate statistical significance. (C) The lifetime distribution of CCPs (number of traces analyzed for control: 90950; Dyn1AA: 103000; Dyn2wt: 91029). (D–F) Intensity cohorts for recruitment of mRuby2-CLCa (red, primary channel) and Dyn-eGFP (green, secondary channel) at CCPs in ARPE mRuby-CLCa cells overexpressing (D) Dyn2wt-eGFP, (E) Dyn1wt-eGFP of (F) Dyn1AA-eGFP (number of traces analyzed for Dyn2wt: 26771; Dyn1wt: 39022; Dyn1AA: 33075). Data are representative of three independent biological repeats.
Similar articles
- A noncanonical role for dynamin-1 in regulating early stages of clathrin-mediated endocytosis in non-neuronal cells.
Srinivasan S, Burckhardt CJ, Bhave M, Chen Z, Chen PH, Wang X, Danuser G, Schmid SL. Srinivasan S, et al. PLoS Biol. 2018 Apr 18;16(4):e2005377. doi: 10.1371/journal.pbio.2005377. eCollection 2018 Apr. PLoS Biol. 2018. PMID: 29668686 Free PMC article. - Differential curvature sensing and generating activities of dynamin isoforms provide opportunities for tissue-specific regulation.
Liu YW, Neumann S, Ramachandran R, Ferguson SM, Pucadyil TJ, Schmid SL. Liu YW, et al. Proc Natl Acad Sci U S A. 2011 Jun 28;108(26):E234-42. doi: 10.1073/pnas.1102710108. Epub 2011 Jun 13. Proc Natl Acad Sci U S A. 2011. PMID: 21670293 Free PMC article. - Isoform and splice-variant specific functions of dynamin-2 revealed by analysis of conditional knock-out cells.
Liu YW, Surka MC, Schroeter T, Lukiyanchuk V, Schmid SL. Liu YW, et al. Mol Biol Cell. 2008 Dec;19(12):5347-59. doi: 10.1091/mbc.e08-08-0890. Epub 2008 Oct 15. Mol Biol Cell. 2008. PMID: 18923138 Free PMC article. - Dissecting dynamin's role in clathrin-mediated endocytosis.
Mettlen M, Pucadyil T, Ramachandran R, Schmid SL. Mettlen M, et al. Biochem Soc Trans. 2009 Oct;37(Pt 5):1022-6. doi: 10.1042/BST0371022. Biochem Soc Trans. 2009. PMID: 19754444 Free PMC article. Review. - Regulation of Clathrin-Mediated Endocytosis.
Mettlen M, Chen PH, Srinivasan S, Danuser G, Schmid SL. Mettlen M, et al. Annu Rev Biochem. 2018 Jun 20;87:871-896. doi: 10.1146/annurev-biochem-062917-012644. Epub 2018 Apr 16. Annu Rev Biochem. 2018. PMID: 29661000 Free PMC article. Review.
Cited by
- Dynamin 1xA interacts with Endophilin A1 via its spliced long C-terminus for ultrafast endocytosis.
Imoto Y, Xue J, Luo L, Raychaudhuri S, Itoh K, Ma Y, Craft GE, Kwan AH, Ogunmowo TH, Ho A, Mackay JP, Ha T, Watanabe S, Robinson PJ. Imoto Y, et al. EMBO J. 2024 Aug;43(16):3327-3357. doi: 10.1038/s44318-024-00145-x. Epub 2024 Jun 21. EMBO J. 2024. PMID: 38907032 Free PMC article. - CALM supports clathrin-coated vesicle completion upon membrane tension increase.
Willy NM, Colombo F, Huber S, Smith AC, Norton EG, Kural C, Cocucci E. Willy NM, et al. Proc Natl Acad Sci U S A. 2021 Jun 22;118(25):e2010438118. doi: 10.1073/pnas.2010438118. Proc Natl Acad Sci U S A. 2021. PMID: 34155137 Free PMC article. - Cell-specific secretory granule sorting mechanisms: the role of MAGEL2 and retromer in hypothalamic regulated secretion.
Štepihar D, Florke Gee RR, Hoyos Sanchez MC, Fon Tacer K. Štepihar D, et al. Front Cell Dev Biol. 2023 Sep 18;11:1243038. doi: 10.3389/fcell.2023.1243038. eCollection 2023. Front Cell Dev Biol. 2023. PMID: 37799273 Free PMC article. Review. - Cellular and structural insight into dynamin function during endocytic vesicle formation: a tale of 50 years of investigation.
Perrais D. Perrais D. Biosci Rep. 2022 Nov 30;42(11):BSR20211227. doi: 10.1042/BSR20211227. Biosci Rep. 2022. PMID: 36156116 Free PMC article. Review. - Evolving models for assembling and shaping clathrin-coated pits.
Chen Z, Schmid SL. Chen Z, et al. J Cell Biol. 2020 Sep 7;219(9):e202005126. doi: 10.1083/jcb.202005126. J Cell Biol. 2020. PMID: 32770195 Free PMC article. Review.
References
- Anggono V, Robinson PJ. (2007). Syndapin I and endophilin I bind overlapping proline-rich regions of dynamin I: role in synaptic vesicle endocytosis. J Neurochem , 931–943. - PubMed
Publication types
MeSH terms
Substances
LinkOut - more resources
Full Text Sources


