MeCP2 links heterochromatin condensates and neurodevelopmental disease - PubMed (original) (raw)
. 2020 Oct;586(7829):440-444.
doi: 10.1038/s41586-020-2574-4. Epub 2020 Jul 22.
Eliot L Coffey # 1 2, Alessandra Dall'Agnese 1, Nancy M Hannett 1, Xin Tang 1, Jonathan E Henninger 1, Jesse M Platt 1 3, Ozgur Oksuz 1, Alicia V Zamudio 1 2, Lena K Afeyan 1 2, Jurian Schuijers 1 4, X Shawn Liu 1 5, Styliani Markoulaki 1, Tenzin Lungjangwa 1, Gary LeRoy 6, Devon S Svoboda 1, Emile Wogram 1, Tong Ihn Lee 1, Rudolf Jaenisch 7 8, Richard A Young 9 10
Affiliations
- PMID: 32698189
- PMCID: PMC7735819
- DOI: 10.1038/s41586-020-2574-4
MeCP2 links heterochromatin condensates and neurodevelopmental disease
Charles H Li et al. Nature. 2020 Oct.
Abstract
Methyl CpG binding protein 2 (MeCP2) is a key component of constitutive heterochromatin, which is crucial for chromosome maintenance and transcriptional silencing1-3. Mutations in the MECP2 gene cause the progressive neurodevelopmental disorder Rett syndrome3-5, which is associated with severe mental disability and autism-like symptoms that affect girls during early childhood. Although previously thought to be a dense and relatively static structure1,2, heterochromatin is now understood to exhibit properties consistent with a liquid-like condensate6,7. Here we show that MeCP2 is a dynamic component of heterochromatin condensates in cells, and is stimulated by DNA to form liquid-like condensates. MeCP2 contains several domains that contribute to the formation of condensates, and mutations in MECP2 that lead to Rett syndrome disrupt the ability of MeCP2 to form condensates. Condensates formed by MeCP2 selectively incorporate and concentrate heterochromatin cofactors rather than components of euchromatic transcriptionally active condensates. We propose that MeCP2 enhances the separation of heterochromatin and euchromatin through its condensate partitioning properties, and that disruption of condensates may be a common consequence of mutations in MeCP2 that cause Rett syndrome.
Figures
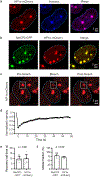
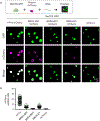
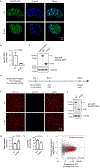
Extended Data Figure 1.. MeCP2 and HP1α are dynamic components of heterochromatin condensates
a. Live-cell images of endogenous-tagged HP1α-mCherry and Hoechst staining in mESCs. b. Live-cell images of endogenous-tagged MeCP2-GFP and HP1α-mCherry in mESCs. c. Live-cell images of FRAP experiments with endogenously tagged HP1α-mCherry mESCs. d. FRAP curves for experiments in Extended Data Fig. 1c. Photobleaching occurs at t = 0 s. Mean±SEM, n=7 cells. e. Half-time of photobleaching recovery for MeCP2-GFP and HP1α-mCherry at heterochromatin condensates in imaging experiments in Fig. 1b and Extended Data Fig. 1c. Mean±SEM, n=7 cells per condition. Two-tailed Student’s t-test: p=0.90, t=0.13, df=12. f. Mobile fractions of MeCP2-GFP and HP1α-mCherry within heterochromatin condensates in imaging experiments in Fig. 1b and Extended Data Fig. 1c, determined by FRAP analysis. Mean±SEM, n=7 cells per condition. Two-tailed Student’s t-test: p=0.09, t=1.87, df=12.
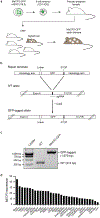
Extended Data Figure 2.. Generation of endogenous-tagged MeCP2-GFP chimeric mice
a. Schematic of MeCP2-GFP chimeric mouse generation using endogenous-tagged MeCP2-GFP mESCs. Endogenous-tagged MeCP2-GFP mESCs derived from V6.5 background were injected into embryos from CD1-IGS mice and multiple embryos were implanted into pseudo-pregnant female mice. Chimeric pups were distinguished from non-chimeric littermates by agouti coat color. MeCP2-GFP tagged adult chimeric mice were used for experiments. b. Schematic of strategy used to generate endogenous-tagged MeCP2-GFP mESCs. c. PCR genotyping of endogenous-tagged MeCP2-GFP mESCs. For gel source data, see Supplementary Figure 1. d. MECP2 expression values in transcripts per million (TPM) measured by RNA-seq for various human tissues surveyed by GTEx. Tissues are ordered based on expression level. TPM values greater than 1 are considered to be expressed.
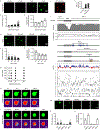
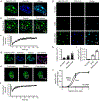
Extended Data Figure 3.. MeCP2 forms phase-separated droplets in vitro
a. Droplet experiments examining effect of MeCP2 concentration. MeCP2-GFP was added to droplet formation buffers with 100 mM NaCl and 10% PEG-8000. b. Droplet areas for experiments in Extended Data Fig. 3a. Fields per condition n=10. c. MeCP2-GFP condensed fraction for experiments in Extended Data Fig. 3a. Mean±SD. Fields per condition n=10. d. Droplet experiments examining effect of salt concentration. MeCP2-GFP at 10 μM was added to droplet formation buffers with indicated NaCl concentrations and 10% PEG-8000. e. Droplet areas for experiments in Extended Data Fig. 3d. Fields per condition n=15. f. MeCP2-GFP condensed fraction for experiments in Extended Data Fig. 3d. Mean±SD. Fields per condition n=15. g. Phase diagram of MeCP2 droplet formation. MeCP2-GFP was added to droplet formation buffers with indicated NaCl concentrations and 5% PEG-8000. Filled-in circles indicate conditions with droplets. Fields per condition n=10. h. Droplet experiments showing MeCP2 droplet fusion. MeCP2-GFP at 10 μM was added to droplet formation buffers with 100 mM NaCl and 10% PEG-8000. i. Droplet experiments showing MeCP2 droplet FRAP. Conditions same as in Extended Data Fig. 3h. Photobleaching at t=0 s. j. Droplet experiments examining HP1α. HP1α-mCherry at 10 μM was added to droplet formation buffers with 100 mM NaCl and 10% PEG-8000. k. DNA-Cy5 partition ratios in MeCP2-GFP droplets for experiments in Fig. 1g. Fields per condition n=15. l. Expanded schematic of MeCP2 protein (Fig. 2a) with protein sequence conservation, net charge per residue (NCPR), and residue plots. m. Droplet experiments examining MeCP2 deletion mutants. MeCP2-GFP deletion mutants at 10 μM were added to droplet formation buffers with 100 mM NaCl and 10% PEG-8000. n. Droplet areas for experiments in Extended Data Fig. 2m. Fields per condition n=5. o. MeCP2-GFP condensed fraction for experiments in Extended Data Fig. 2m. Mean±SD. Fields per condition n=5.
Extended Data Figure 4.. MeCP2 condensates preferentially concentrate HP1α compared to components of transcriptional condensates
a. Immunofluorescence images of heterochromatin condensates (MeCP2-GFP) and transcriptional condensates (Anti-MED1) in mESCs. b. Droplet experiments examining ability of MeCP2 condensates to preferentially concentrate HP1α compared to components of transcriptional condensates. MeCP2-GFP at 7.5 μM was mixed with HP1α-mCherry, MED1-IDR-mCherry, BRD4-IDR-mCherry, or mCherry at 7.5 μM in droplet formation buffers with 150 mM NaCl and 10% PEG-8000. c. mCherry partition ratios in MeCP2-GFP droplets for experiments in Extended Data Fig. 4b. Fields per condition n=15. d. Droplet experiments with naked DNA examining ability of MeCP2 condensates to preferentially concentrate HP1α compared to components of transcriptional condensates. Conditions same as in Extended Data Fig. 4b, but with addition of 160 nM DNA. e. mCherry partition ratios in MeCP2-GFP droplets for experiments in Extended Data Fig. 4d. Fields per condition n=15. f. Droplet experiments with nucleosomal DNA examining ability of MeCP2 condensates to preferentially concentrate HP1α compared to components of transcriptional condensates. MeCP2-GFP at 5 μM was mixed with HP1α-mCherry, MED1-IDR-mCherry, BRD4-IDR-mCherry, or mCherry at 5 μM and 6 nM poly-nucleosomes in droplet formation buffers with 100 mM NaCl and 3 mM MgCl2. g. mCherry partition ratios in MeCP2-GFP droplets for experiments in Extended Data Fig. 4f. Fields per condition n=10. h. Brightfield images examining droplet formation with nucleosomal DNA alone and with MeCP2. Poly-nucleosomes at 6 nM were mixed with 5 μM MeCP2-GFP or no MeCP2-GFP in droplet formation buffers with 100 mM NaCl and 3 mM MgCl2. i. Droplet experiments examining MeCP2 droplet formation with nucleosomal DNA. Conditions same as in Extended Data Fig. 4h. j. Droplet areas for experiments in Extended Data Fig. 4i. Fields per condition n=10. k. MeCP2-GFP condensed fraction for experiments in Extended Data Fig. 4i. Mean±SD. Fields per condition n=10.
Extended Data Figure 5.. MeCP2 condensate partitioning of BRD4 domains
a. Droplet experiments examining ability of MeCP2 condensates to preferentially incorporate and concentrate HP1α compared to BRD4 domains in the presence of naked DNA. BRD4-IDR, bromodomain 1 (BD1), and extra-terminal (ET) domain were examined. MeCP2-GFP at 7.5 μM was mixed with either HP1α-mCherry, BRD4-IDR-mCherry, BRD4-BD1-mCherry, BRD4-ET-mCherry, or mCherry each at 7.5 μM and 160 nM methylated DNA in droplet formation buffers with 150 mM NaCl and 10% PEG-8000. b. mCherry partition ratios in MeCP2-GFP droplets for experiments in Extended Data Fig. 5a. Fields per condition n=15.
Extended Data Figure 6.. RTT patient mutations disrupt MeCP2 condensate formation
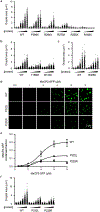
a. Droplet areas for experiments in Fig. 3b. Fields per condition n=15. b. Droplet areas for experiments in Fig. 3d. Fields per condition n=15. c. Droplet areas for experiments in Fig. 3f. Fields per condition n=15. d. Droplet experiments examining effects of RTT patient missense mutations that disrupt IDR-2 on MeCP2 droplet formation. MeCP2-GFP WT and RTT IDR-2 mutants (P225R and P322L) at indicated concentrations were mixed with 20 nM methylated DNA in droplet formation buffers with 100 mM NaCl. e. MeCP2-GFP condensed fraction as a function of MeCP2-GFP concentration for experiments in Extended Data Fig. 6d. Mean±SD. Fields per condition n=15. f. Droplet areas for experiments in Extended Data Fig. 6d. Fields per condition n=15.
Extended Data Figure 7.. TBLR1 partitioning into MeCP2 droplets is disrupted by RTT mutation R306C
a. Droplet experiments examining ability of MeCP2 WT and R306C mutant condensates to enrich TBLR1-CTD. MeCP2-GFP WT or R306C mutant at 6 μM was mixed with TBLR1-CTD-mCherry at 10 μM in droplet formation buffers with 125 mM NaCl and 10% PEG-8000. b. TBLR1-CTD-mCherry partition ratios in MeCP2-GFP WT and R306C mutant droplets for experiments in Extended Data Fig. 7a. Fields per condition n=15. c. Droplet experiments examining ability of MeCP2 WT and R306C mutant condensates to enrich TBLR1-CTD. MeCP2-GFP WT or R306C mutant at 10 μM was mixed with TBLR1-CTD-mCherry at 4 μM in droplet formation buffers with 125 mM NaCl. d. TBLR1-CTD-mCherry partition ratios in MeCP2-GFP WT and R306C mutant droplets for experiments in Extended Data Fig. 7c. Fields per condition n=12.
Extended Data Figure 8.. MeCP2 Mini forms droplets in vitro and partitions into heterochromatin condensates in mESCs
a. Schematic of MeCP2 protein with a minimal MeCP2 protein (Mini) (Tillotson et al., Nature 2017) that retains the MBD and NID displayed below. b. Droplet experiments examining ability of Mini MeCP2 to form droplets. MeCP2-GFP WT and Mini at 4 μM were added to droplet formation buffers with 125 mM NaCl and 10% PEG-8000. c. Droplet areas for experiments in Extended Data Fig. 8b. Fields per condition n=12. d. MeCP2-GFP condensed fraction for experiments in Extended Data Fig. 8b. Mean±SD. Fields per condition n=12. e. Droplet experiments examining ability of MeCP2 WT and Mini to form droplets with HP1α and DNA. MeCP2-GFP WT or Mini at 7.5 μM was mixed with 7.5 μM HP1α-mCherry and 160 nM DNA in droplet formation buffers with 150 mM NaCl and 10% PEG-8000. f. HP1α-mCherry partition ratios in MeCP2-GFP WT and Mini droplets for experiments in Extended Data Fig. 8e. Fields per condition n=15. g. DNA-Cy5 partition ratios in MeCP2-GFP WT and Mini droplets for experiments in Extended Data Fig. 8e. Fields per condition n=15. h. Droplet experiments examining ability of MeCP2 WT and Mini condensates to enrich TBLR1-CTD. MeCP2-GFP WT or Mini at 4 μM was mixed with TBLR1-CTD-mCherry at 10 μM in droplet formation buffers with 125 mM NaCl and 10% PEG-8000. i. TBLR1-CTD-mCherry partition ratios in MeCP2-GFP WT and Mini droplets for experiments in Extended Data Fig. 8h. Fields per condition n=12. j. Live-cell microscopy of endogenous-tagged MeCP2-GFP WT and Mini proteins with Hoechst staining in mESCs. k. Partition ratios of MeCP2-GFP proteins at heterochromatin condensates for experiments in Extended Data Fig. 8j. Mean±SD, n=10 cells per condition. Two-tailed Student’s t-test: p=0.1161, t=1.6509, df=18.
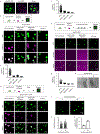
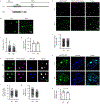
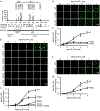
Extended Data Figure 9.. R168X mutant MeCP2 displays reduced partitioning into heterochromatin condensates and causes disease-relevant cellular phenotypes in mESCs
a. Live-cell images of endogenous-tagged MeCP2-GFP WT and R168X mutant proteins with Hoechst staining in mESCs. b. Partition ratios of MeCP2-GFP proteins at heterochromatin condensates for experiments in Extended Data Fig. 9a. Mean±SD, cells per condition: WT (n=11), R168X (n=10). Two-tailed Student’s t-test: p<0.0001, t=12.13, df=19. c. MeCP2-GFP signal in endogenous-tagged MeCP2-GFP WT and R168X mutant mESCs measured by flow cytometry. Mean±SD, n=3 biologically independent samples per condition. d. Western blot of endogenous-tagged MeCP2-GFP WT and R168X mutant mESCs. Anti-H3 was used as a processing control. For gel source data, see Supplementary Figure 1. e. Number of heterochromatin condensates per cell in endogenous-tagged MeCP2-GFP WT and R168X mutant mESCs. Mean±SD, n=16 cells per condition. Two-tailed Student’s t-test: p=0.0149, t=2.5832, df=30. f. Heterochromatin condensate volumes in endogenous-tagged MeCP2-GFP WT and R168X mutant mESCs. Mean±SD, condensates per condition: WT (n=206), R168X (n=273). Two-tailed Student’s t-test: p<0.0001, t=4.2065, df=477. g. Live-cell images of endogenous-tagged MeCP2-GFP (WT or R168X mutant) and HP1α-mCherry in mESCs. h. Partition ratios of HP1α-mCherry at heterochromatin condensates for experiments in Extended Data Fig. 9g. Mean±SD, cells per condition: WT (n=6), R168X (n=20). Two-tailed Student’s t-test: p<0.0001, t=5.7136, df=24. i. HP1α-mCherry signal in endogenous-tagged MeCP2-GFP (WT or R168X mutant) and HP1α-mCherry mESCs measured by flow cytometry. Mean±SD, n=3 biologically independent samples per condition. j. Normalized major satellite repeat expression in endogenous-tagged MeCP2-GFP WT and R168X mutant mESCs. Mean±SD, n=3 biologically independent samples per condition. Two-tailed Student’s t-test: p=0.0017, t=7.5436, df=4. k. Total RNA per cell in endogenous-tagged MeCP2-GFP WT and R168X mutant mESCs. Mean±SD, n=3 biologically independent samples per condition. Two-tailed Student’s t-test: p=0.0324, t=3.2154, df=4. l. RNA-seq comparing endogenous-tagged MeCP2-GFP WT and R168X mutant mESCs. Differentially expressed genes (red dots) were determined by two-tailed Wald test with multiple test adjusted p-value<0.1. For both conditions, n=3 biologically independent samples.
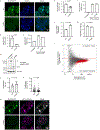
Extended Data Figure 10.. R168X mutant in mESCs and neurons
a. Live-cell images of mESCs overexpressing either WT or R168X mutant MeCP2-GFP. b. Partition ratios of MeCP2-GFP proteins at heterochromatin condensates relative to the nucleoplasm for experiments in Extended Data Fig. 10a. Mean±SD, cells per condition: WT (n=3), R168X (n=5). Two-tailed Student’s t-test: p=0.0008, t=6.1529, df=6. c. Western blot of mESCs overexpressing either WT or R168X mutant MeCP2-GFP. Anti-H3 was used as a processing control. For gel source data, see Supplementary Figure 1. d. Schematic of generation of mESC-derived neurons. Endogenous-tagged MeCP2-GFP WT and R168X mESCs were modified for Dox-inducible NGN2 expression using the PiggyBac system. Prior to neuronal differentiation, mESCs were seeded on astrocytes. Neuronal differentiation was induced by adding doxycycline to drive NGN2 expression. Five days after induction of NGN2 expression, neurons were analyzed. e. Fixed-cell immunofluorescence images of neurons derived from MeCP2-GFP WT and R168X mutant mESCs. Anti-TuJ1 staining was used to distinguish neurons. f. Western blot of endogenous-tagged MeCP2-GFP WT and R168X mutant neurons. Anti-H3 was used as a loading control. For gel source data, see Supplementary Figure 1. g. Normalized major satellite repeat expression in endogenous-tagged MeCP2-GFP WT and R168X mutant neurons. Mean±SD, n=3 biologically independent samples per condition. Two-tailed Student’s t-test: p=0.0061, t=5.3004, df=4. h. Total RNA per cell in endogenous-tagged MeCP2-GFP WT and R168X neurons. Mean±SD, n=3 biologically independent samples per condition. Two-tailed Student’s t-test: p=0.0141, t=4.1676, df=4. i. RNA-seq comparing endogenous-tagged MeCP2-GFP WT and R168X mutant neurons. Differentially expressed genes (red dots) were identified using a two-tailed Wald test with multiple test adjusted p-value<0.1. For both conditions, n=3 biologically independent samples.
Figure 1.. MeCP2 forms condensates in vivo and in vitro
a. Live-cell images of endogenous-tagged MeCP2-GFP and Hoechst staining in mESCs. b. Live-cell images of FRAP experiments with endogenous-tagged MeCP2-GFP mESCs. c. FRAP curves for experiments in Fig. 1b. Photobleaching occurs at t = 0 s. Mean±SD, n=7 cells. d. Fixed-cell images of endogenous-tagged MeCP2-GFP brain sections from chimeric mice. e. Images of FRAP experiments performed on acute brain slices from endogenous-tagged MeCP2-GFP chimeric mice. f. FRAP curves for experiments in Fig. 1e. Photobleaching occurs at t = 0 s. Mean±SEM, n=3 cells. g. Droplet experiments examining MeCP2 droplet formation with DNA. MeCP2-GFP at 2 μM was mixed with 160 nM unmethylated DNA (DNA), methylated DNA (methyl-DNA), or no DNA in droplet formation buffers with 100 mM NaCl. h. Droplet areas for experiments in Fig. 1g. Fields per condition n=15. i. MeCP2-GFP condensed fraction for experiments in Fig. 1g. Mean±SD. Fields per condition n=15. j. MeCP2-GFP condensed fraction curves for experiments examining MeCP2 droplet formation with DNA. MeCP2-GFP was mixed with 160 nM DNA, methyl-DNA, or no DNA in droplet formation buffers with 100 mM NaCl. Mean±SD. Fields per condition n=15.
Figure 2.. MeCP2 features that contribute to condensate formation
a. Schematic of MeCP2 protein indicating the MBD, IDR-1, IDR-2, and sequence features within IDR-2 previously implicated in condensate formation for other proteins. Contribution of IDR-2 sequence features to condensate formation was examined using deletion mutants that remove the basic patches (ΔBasic), aromatic residues (ΔAromatic), histidine-rich patch (ΔHistidine), and proline-rich patch (ΔProline). Predicted protein disorder is displayed below. b. Droplet experiments examining ability of MeCP2 deletion mutants to form droplets with DNA. MeCP2-GFP deletion mutants at 2 μM were mixed with 40 nM DNA in droplet formation buffers with 100 mM NaCl. c. Droplet areas for experiments in Fig. 2b. Fields per condition n=15. d. MeCP2-GFP condensed fraction for experiments in Fig. 2b. Mean±SD. Fields per condition n=15. e. Droplet experiments examining ability of MeCP2 IDR-2 sequence feature deletion mutants to form droplets. MeCP2-GFP IDR-2 sequence feature deletion mutants at 10 μM were added to droplet formation buffers with 150 mM NaCl and 10% PEG-8000. f. Droplet areas for experiments in Fig. 2e. Fields per condition n=10. g. MeCP2-GFP condensed fraction for experiments in Fig. 2e. Mean±SD. Fields per condition n=10. h. Schematic of transcriptional repression reporter assay used to examine the ability of MeCP2 IDR-2 sequence features to contribute to transcriptional repression. i. Normalized luciferase signals for reporter assay examining ability of MeCP2 IDR-2 sequence features to contribute to transcriptional repression. Luciferase signal was normalized to GAL4-DBD alone. Mean±SD, n=3 biologically independent samples per condition.
Figure 3.. RTT patient mutations disrupt MeCP2 condensate formation
a. Schematic of MeCP2 protein with bar chart displaying the number of MECP2 coding mutations in female Rett syndrome patients found in RettBASE database for each amino acid position. Positions of nonsense, frameshift, and missense mutations are shown below. b. Droplet experiments examining effects of RTT patient truncation mutations that disrupt IDR-2 on MeCP2 droplet formation. MeCP2-GFP WT and RTT IDR-2 mutants (R168X, R255X, R270X, R294X, P389X) at indicated concentrations were mixed with 40 nM methylated DNA in droplet formation buffers with 100 mM NaCl. c. MeCP2-GFP condensed fraction as a function of MeCP2-GFP concentration for experiments in Fig. 3b. Mean±SD. Fields per condition n=15. d. Droplet experiments examining the effects of RTT patient missense mutations that disrupt the MBD on MeCP2 droplet formation. MeCP2-GFP WT and RTT MBD mutants (R133C and T158M) at indicated concentrations were mixed with 20 nM methylated DNA in droplet formation buffers with 100 mM NaCl. e. MeCP2-GFP condensed fraction as a function of MeCP2-GFP concentration for experiments in Fig. 3d. Mean±SD. Fields per condition n=15. f. Droplet experiments examining effect of RTT patient missense mutation R306C on MeCP2 droplet formation. MeCP2-GFP WT and RTT R306C mutant at indicated concentrations were mixed with 20 nM methylated DNA in droplet formation buffers with 100 mM NaCl. g. MeCP2-GFP condensed fraction as a function of MeCP2-GFP concentration for experiments in Fig. 3f. Mean±SD. Fields per condition n=15.
Figure 4.. R168X mutant MeCP2 displays reduced partitioning into heterochromatin condensates and causes disease-relevant cellular phenotypes in neurons
a. Live-cell images of endogenous-tagged MeCP2-GFP WT and R168X mutant proteins with Hoechst and SiR-Tubulin staining in neurons. b. Partition ratios of MeCP2-GFP proteins at heterochromatin condensates for experiments in Fig. 4a. Mean±SD, n=10 cells per condition. Two-tailed Student’s t-test: p<0.0001, t=8.8921, df=18. c. Number of heterochromatin condensates per cell in endogenous-tagged MeCP2-GFP WT and R168X mutant neurons. Mean±SD, n=13 cells per condition. Two-tailed Student’s t-test: p=0.0353, t=2.2314, df=24. d. Heterochromatin condensate volumes in endogenous-tagged MeCP2-GFP WT and R168X mutant neurons. Mean±SD, condensates per condition: WT (n=311), R168X (n=252). Two-tailed Student’s t-test: p=0.2239, t=1.2176, df=561. e. Live-cell images of endogenous-tagged MeCP2-GFP (WT or R168X mutant) and HP1α-mCherry in neurons. f. Partition ratios of HP1α-mCherry at heterochromatin condensates for experiments in Fig. 4e. Mean±SD, n=8 cells per condition. Two-tailed Student’s t-test: p=0.0027, t=3.6444, df=14. g. Model of interactions contributing to MeCP2 condensate formation with DNA.
Similar articles
- ATRX Contributes to MeCP2-Mediated Pericentric Heterochromatin Organization during Neural Differentiation.
Marano D, Fioriniello S, Fiorillo F, Gibbons RJ, D'Esposito M, Della Ragione F. Marano D, et al. Int J Mol Sci. 2019 Oct 29;20(21):5371. doi: 10.3390/ijms20215371. Int J Mol Sci. 2019. PMID: 31671722 Free PMC article. - Rett syndrome-causing mutations compromise MeCP2-mediated liquid-liquid phase separation of chromatin.
Wang L, Hu M, Zuo MQ, Zhao J, Wu D, Huang L, Wen Y, Li Y, Chen P, Bao X, Dong MQ, Li G, Li P. Wang L, et al. Cell Res. 2020 May;30(5):393-407. doi: 10.1038/s41422-020-0288-7. Epub 2020 Feb 28. Cell Res. 2020. PMID: 32111972 Free PMC article. - MeCP2 Rett mutations affect large scale chromatin organization.
Agarwal N, Becker A, Jost KL, Haase S, Thakur BK, Brero A, Hardt T, Kudo S, Leonhardt H, Cardoso MC. Agarwal N, et al. Hum Mol Genet. 2011 Nov 1;20(21):4187-95. doi: 10.1093/hmg/ddr346. Epub 2011 Aug 10. Hum Mol Genet. 2011. PMID: 21831886 - MeCP2 dysfunction in Rett syndrome and related disorders.
Moretti P, Zoghbi HY. Moretti P, et al. Curr Opin Genet Dev. 2006 Jun;16(3):276-81. doi: 10.1016/j.gde.2006.04.009. Epub 2006 May 2. Curr Opin Genet Dev. 2006. PMID: 16647848 Review. - Associations between MeCP2 mutations, X-chromosome inactivation, and phenotype.
Hoffbuhr KC, Moses LM, Jerdonek MA, Naidu S, Hoffman EP. Hoffbuhr KC, et al. Ment Retard Dev Disabil Res Rev. 2002;8(2):99-105. doi: 10.1002/mrdd.10026. Ment Retard Dev Disabil Res Rev. 2002. PMID: 12112735 Review.
Cited by
- The 3D Genome in Brain Development: An Exploration of Molecular Mechanisms and Experimental Methods.
Rahman S, Roussos P. Rahman S, et al. Neurosci Insights. 2024 Oct 29;19:26331055241293455. doi: 10.1177/26331055241293455. eCollection 2024. Neurosci Insights. 2024. PMID: 39494115 Free PMC article. Review. - The Molecular Functions of MeCP2 in Rett Syndrome Pathology.
Sharifi O, Yasui DH. Sharifi O, et al. Front Genet. 2021 Apr 23;12:624290. doi: 10.3389/fgene.2021.624290. eCollection 2021. Front Genet. 2021. PMID: 33968128 Free PMC article. Review. - Evolutional heterochromatin condensation delineates chromocenter formation and retrotransposon silencing in plants.
Zhang W, Cheng L, Li K, Xie L, Ji J, Lei X, Jiang A, Chen C, Li H, Li P, Sun Q. Zhang W, et al. Nat Plants. 2024 Aug;10(8):1215-1230. doi: 10.1038/s41477-024-01746-4. Epub 2024 Jul 16. Nat Plants. 2024. PMID: 39014153 - Understanding autism spectrum disorders with animal models: applications, insights, and perspectives.
Li Z, Zhu YX, Gu LJ, Cheng Y. Li Z, et al. Zool Res. 2021 Nov 18;42(6):800-824. doi: 10.24272/j.issn.2095-8137.2021.251. Zool Res. 2021. PMID: 34755500 Free PMC article. Review. - Advances in the pathogenesis of Rett syndrome using cell models.
Lu S, Chen Y, Wang Z. Lu S, et al. Animal Model Exp Med. 2022 Dec;5(6):532-541. doi: 10.1002/ame2.12236. Epub 2022 Jul 4. Animal Model Exp Med. 2022. PMID: 35785421 Free PMC article. Review.
References
- Janssen A, Colmenares SU & Karpen GH Heterochromatin: guardian of the genome. Annu. Rev. Cell Dev. Biol 34, 265–288 (2018). - PubMed
- Lyst MJ & Bird A Rett syndrome: a complex disorder with simple roots. Nat. Rev. Genet 16, 261–274 (2015). - PubMed
- Amir RE et al. Rett syndrome is caused by mutations in X-linked MECP2, encoding methyl-CpG-binding protein 2. Nat. Genet 23, 185–188 (1999). - PubMed
Publication types
MeSH terms
Substances
Grants and funding
- R01 GM123511/GM/NIGMS NIH HHS/United States
- T32 GM007287/GM/NIGMS NIH HHS/United States
- R01 MH104610/MH/NIMH NIH HHS/United States
- 2 R01 MH104610-20/NH/NIH HHS/United States
- K99 MH113813/MH/NIMH NIH HHS/United States
- T32 GM087237/GM/NIGMS NIH HHS/United States
- R00 MH113813/MH/NIMH NIH HHS/United States
- R37 CA084198/CA/NCI NIH HHS/United States
- T32 5T3DK007191-45/NH/NIH HHS/United States
- T32 DK007191/DK/NIDDK NIH HHS/United States
LinkOut - more resources
Full Text Sources
Other Literature Sources
Molecular Biology Databases
