The protein expression profile of ACE2 in human tissues - PubMed (original) (raw)
The protein expression profile of ACE2 in human tissues
Feria Hikmet et al. Mol Syst Biol. 2020 Jul.
Abstract
The novel SARS-coronavirus 2 (SARS-CoV-2) poses a global challenge on healthcare and society. For understanding the susceptibility for SARS-CoV-2 infection, the cell type-specific expression of the host cell surface receptor is necessary. The key protein suggested to be involved in host cell entry is angiotensin I converting enzyme 2 (ACE2). Here, we report the expression pattern of ACE2 across > 150 different cell types corresponding to all major human tissues and organs based on stringent immunohistochemical analysis. The results were compared with several datasets both on the mRNA and protein level. ACE2 expression was mainly observed in enterocytes, renal tubules, gallbladder, cardiomyocytes, male reproductive cells, placental trophoblasts, ductal cells, eye, and vasculature. In the respiratory system, the expression was limited, with no or only low expression in a subset of cells in a few individuals, observed by one antibody only. Our data constitute an important resource for further studies on SARS-CoV-2 host cell entry, in order to understand the biology of the disease and to aid in the development of effective treatments to the viral infection.
Keywords: ACE2; SARS-CoV-2; immunohistochemistry; respiratory system; transcriptomics.
© 2020 The Authors. Published under the terms of the CC BY 4.0 license.
Conflict of interest statement
The authors declare that they have no conflict of interest.
Figures
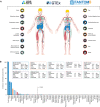
Figure 1. ACE2 expression in human tissues based on transcriptomics
- Overview of the tissues and organs analyzed based on transcriptomics by the three independent consortia Human Protein Atlas (HPA), FANTOM5, and GTEx. In total, 16 organ systems (with several tissues comprising an organ system) were used to create a consensus normalized expression (defined as the unit NX) based on the expression levels of all three datasets.
- ACE2 gene expression summary in human tissues in 61 different tissues and cells in NX. Cutoff for what is regarded as expressed was set to 1.0 NX.
Figure 2. ACE2 expression in human tissues based on single‐cell transcriptomics
Dot plots summarizing the transcriptomics levels of ACE2 based on different scRNA‐seq datasets and tissues. Three different scales were used, in order to be able to compare percentages of cells expressing ACE2 both between and within tissue types. The size of the dots indicates the percentage of cells expressing ACE2 in respective cell type with a maximum of 60% (left column), 10% (middle column) and 1% (right column), and the color saturation corresponds to the average expression level. Plots were generated using Seurat package in R.
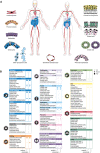
Figure 3. ACE2 protein expression in human tissues based on immunohistochemistry
- Summary of cell types positive for ACE2 using at least one antibody. Illustrations were in part adapted from https://biorender.com/.
- Details of cell type‐specific protein expression levels based on immunohistochemistry in tissues showing distinct immunohistochemical staining in at least one cell type using at least one antibody. Left panel: MAB933 (R&D Systems). Right panel: HPA000288 (Atlas Antibodies). Dot size: level of immunohistochemical staining based on staining intensity and fraction of positive cells. Asterisk: no ACE2 protein expression was observed in the standard TMA analysis, however ACE2 protein expression in lung AT2 cells was detected in an extended lung TMA cohort.
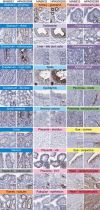
Figure 4. Cell type‐specific localization of ACE2 in human tissues based on immunohistochemistry
Representative images of 20 tissue types and histological structures stained on consecutive sections with immunohistochemistry using two antibodies targeting human ACE2 protein (brown), and counterstained with hematoxylin (blue). Most intense antibody staining was observed in microvilli of the intestinal tract and renal proximal tubules, in membranes of gallbladder epithelium, epididymis epithelium, testicular Sertoli cells and Leydig cells, a subset of glandular cells in seminal vesicle and cytoplasm of cardiomyocytes, with HPA000288 also staining the cardiac muscle fibers, while MAB933 only showed staining in a few cells. Distinct ACE2 staining for both antibodies was also present in cornea and conjunctiva of the eye, interlobular pancreatic ducts, as well as in placental villi, both in cytotrophoblasts, syncytiotrophoblasts, and also in extravillous trophoblasts, while placenta decidua was negative. ACE2 staining could be observed at the base of ciliated fallopian tube epithelium, however only for one of the antibodies. Note that ACE2 protein expression was less prominent in the crypts of the mucosal intestinal layer. ACE2 was also positive in endothelial cells and pericytes in several tissues, see fallopian tube, thyroid, parathyroid, adrenal gland, pancreas, and heart. Scale bar = 50 μm. Scale bar in dashed squares = 10 μm (Brunner = Brunner's gland, EVT = extravillous trophoblasts, endo = endothelial cells).
Figure EV1. Human tissues with no ACE2 protein expression based on immunohistochemistry
Representative images of various human tissues and histological structures with no ACE2 protein expression, stained on consecutive sections with immunohistochemistry using two antibodies targeting the ACE2 protein and counterstained with hematoxylin (blue). Scale bar = 50 μm.
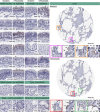
Figure 5. Cell type‐specific localization of ACE2 in human respiratory system based on immunohistochemistry
Representative images of human respiratory tissues, all stained on consecutive sections, with immunohistochemistry using two antibodies targeting human ACE2 protein (brown), and counterstained with hematoxylin (blue). Respiratory tissues were composed of different structures in nasal mucosa, bronchus, smaller bronchioles, and lung parenchyma. ACE2 staining could be observed at the base of ciliated cells in both nasal mucosa and bronchial epithelium (arrowheads). Rare ACE2 staining was present in a few alveolar cells (arrows). No staining was observed in nasal squamous epithelium, bronchioles, or submucosal glands in either tissue. Gender and age are shown for all individuals. Red and green colored squares mark the positions in the TMA cores shown as magnifications. Scale bar = 50 μm. Scale bar for images in dashed squares = 10 μm (re = respiratory; sq = squamous).
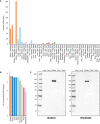
Figure 6. ACE2 expression in human tissues based on mass spectrometry and Western blot
- ACE2 protein abundance in different human tissues based on various studies processed by PaxDB, with expression levels presented as parts per million (ppm). The “Integrated” dataset corresponds to PaxDB estimation of average expression.
- ACE2 protein abundance in different human tissues from ProteomicsDB, with the median expression presented in log10(iBAQ).
- Western blot of ACE2 using five different human tissue lysates. For lung, two different lysates were used: one male (left) and one female (right).
Similar articles
- A comprehensive investigation of the mRNA and protein level of ACE2, the putative receptor of SARS-CoV-2, in human tissues and blood cells.
Wang Y, Wang Y, Luo W, Huang L, Xiao J, Li F, Qin S, Song X, Wu Y, Zeng Q, Jin F, Wang Y. Wang Y, et al. Int J Med Sci. 2020 Jun 18;17(11):1522-1531. doi: 10.7150/ijms.46695. eCollection 2020. Int J Med Sci. 2020. PMID: 32669955 Free PMC article. - Expressions and significances of the angiotensin-converting enzyme 2 gene, the receptor of SARS-CoV-2 for COVID-19.
Fu J, Zhou B, Zhang L, Balaji KS, Wei C, Liu X, Chen H, Peng J, Fu J. Fu J, et al. Mol Biol Rep. 2020 Jun;47(6):4383-4392. doi: 10.1007/s11033-020-05478-4. Epub 2020 May 14. Mol Biol Rep. 2020. PMID: 32410141 Free PMC article. - Expression of the SARS-CoV-2 cell receptor gene ACE2 in a wide variety of human tissues.
Li MY, Li L, Zhang Y, Wang XS. Li MY, et al. Infect Dis Poverty. 2020 Apr 28;9(1):45. doi: 10.1186/s40249-020-00662-x. Infect Dis Poverty. 2020. PMID: 32345362 Free PMC article. - SARS-CoV-2 pandemic and research gaps: Understanding SARS-CoV-2 interaction with the ACE2 receptor and implications for therapy.
Datta PK, Liu F, Fischer T, Rappaport J, Qin X. Datta PK, et al. Theranostics. 2020 Jun 12;10(16):7448-7464. doi: 10.7150/thno.48076. eCollection 2020. Theranostics. 2020. PMID: 32642005 Free PMC article. Review. - Angiotensin-converting enzyme 2 (ACE2), SARS-CoV-2 and the pathophysiology of coronavirus disease 2019 (COVID-19).
Bourgonje AR, Abdulle AE, Timens W, Hillebrands JL, Navis GJ, Gordijn SJ, Bolling MC, Dijkstra G, Voors AA, Osterhaus AD, van der Voort PH, Mulder DJ, van Goor H. Bourgonje AR, et al. J Pathol. 2020 Jul;251(3):228-248. doi: 10.1002/path.5471. Epub 2020 Jun 10. J Pathol. 2020. PMID: 32418199 Free PMC article. Review.
Cited by
- COVID-19 and diabetes in children.
Prosperi S, Chiarelli F. Prosperi S, et al. Ann Pediatr Endocrinol Metab. 2022 Sep;27(3):157-168. doi: 10.6065/apem.2244150.075. Epub 2022 Sep 30. Ann Pediatr Endocrinol Metab. 2022. PMID: 36203266 Free PMC article. - Expression of the SARS-CoV-2 Receptor ACE2 in Human Retina and Diabetes-Implications for Retinopathy.
Zhou L, Xu Z, Guerra J, Rosenberg AZ, Fenaroli P, Eberhart CG, Duh EJ. Zhou L, et al. Invest Ophthalmol Vis Sci. 2021 Jun 1;62(7):6. doi: 10.1167/iovs.62.7.6. Invest Ophthalmol Vis Sci. 2021. PMID: 34086044 Free PMC article. - Proteomics-Based Insights Into the SARS-CoV-2-Mediated COVID-19 Pandemic: A Review of the First Year of Research.
Praissman JL, Wells L. Praissman JL, et al. Mol Cell Proteomics. 2021;20:100103. doi: 10.1016/j.mcpro.2021.100103. Epub 2021 Jun 4. Mol Cell Proteomics. 2021. PMID: 34089862 Free PMC article. Review. - Receptor binding domain (RBD) antibodies contribute more to SARS-CoV-2 neutralization when target cells express high levels of ACE2.
Farrell AG, Dadonaite B, Greaney AJ, Eguia R, Loes AN, Franko NM, Logue J, Carreño JM, Abbad A, Chu HY, Matreyek KA, Bloom JD. Farrell AG, et al. bioRxiv [Preprint]. 2022 Aug 30:2022.08.29.505713. doi: 10.1101/2022.08.29.505713. bioRxiv. 2022. PMID: 36093349 Free PMC article. Updated. Preprint. - Soluble angiotensin-converting enzyme 2 association with lipid metabolism.
Nagatomo I, Nakanishi K, Yamamoto R, Ide S, Ishibashi C, Moriyama T, Yamauchi-Takihara K. Nagatomo I, et al. Front Med (Lausanne). 2022 Aug 10;9:955928. doi: 10.3389/fmed.2022.955928. eCollection 2022. Front Med (Lausanne). 2022. PMID: 36035417 Free PMC article.
References
- Aguiar JA, Tremblay BJ, Mansfield MJ, Woody O, Lobb B, Banerjee A, Chandiramohan A, Tiessen N, Dvorkin‐Gheva A, Revill S et al (2020) Gene expression and in situ protein profiling of candidate SARS‐CoV‐2 receptors in human airway epithelial cells and lung tissue. bioRxiv 10.1101/2020.04.07.030742 [PREPRINT] - DOI - PMC - PubMed
- Chen L, Liu HG, Liu W, Liu J, Liu K, Shang J, Deng Y, Wei S (2020b) Analysis of clinical features of 29 patients with 2019 novel coronavirus pneumonia. Zhonghua Jie He He Hu Xi Za Zhi 43: 203–208 - PubMed
Publication types
MeSH terms
Substances
LinkOut - more resources
Full Text Sources
Other Literature Sources
Molecular Biology Databases
Miscellaneous
