An Unbiased Molecular Approach Using 3'-UTRs Resolves the Avian Family-Level Tree of Life - PubMed (original) (raw)
Comparative Study
An Unbiased Molecular Approach Using 3'-UTRs Resolves the Avian Family-Level Tree of Life
Heiner Kuhl et al. Mol Biol Evol. 2021.
Abstract
Presumably, due to a rapid early diversification, major parts of the higher-level phylogeny of birds are still resolved controversially in different analyses or are considered unresolvable. To address this problem, we produced an avian tree of life, which includes molecular sequences of one or several species of ∼90% of the currently recognized family-level taxa (429 species, 379 genera) including all 106 family-level taxa of the nonpasserines and 115 of the passerines (Passeriformes). The unconstrained analyses of noncoding 3-prime untranslated region (3'-UTR) sequences and those of coding sequences yielded different trees. In contrast to the coding sequences, the 3'-UTR sequences resulted in a well-resolved and stable tree topology. The 3'-UTR contained, unexpectedly, transcription factor binding motifs that were specific for different higher-level taxa. In this tree, grebes and flamingos are the sister clade of all other Neoaves, which are subdivided into five major clades. All nonpasserine taxa were placed with robust statistical support including the long-time enigmatic hoatzin (Opisthocomiformes), which was found being the sister taxon of the Caprimulgiformes. The comparatively late radiation of family-level clades of the songbirds (oscine Passeriformes) contrasts with the attenuated diversification of nonpasseriform taxa since the early Miocene. This correlates with the evolution of vocal production learning, an important speciation factor, which is ancestral for songbirds and evolved convergent only in hummingbirds and parrots. As 3'-UTR-based phylotranscriptomics resolved the avian family-level tree of life, we suggest that this procedure will also resolve the all-species avian tree of life.
Keywords: 3′-UTR; bioinformatics; birds; phylogenetics; transcriptomes; vocal learning.
© The Author(s) 2020. Published by Oxford University Press on behalf of the Society for Molecular Biology and Evolution.
Figures
Fig. 1.
Analysis of tree topology congruency for different noncoding and coding data types (A_–_C) and taxon-specific sequences in 3′-UTRs (D). In (A), multiple tree inferences using distinct starting trees and subsequent refinement by nearest neighbor interchange (NNI) moves resulted in a better tree topology congruency (lower Robinson–Foulds distance) for 3′-UTR trees (UTR, 3′-UTRs of all species; UTR393, 3′-UTRs including only seven genomes of which no transcriptomes were available) as compared with trees calculated from similar amounts of coding sequence data (CDN, codons of all species; CDN12, codon positions 1 and 2 only, all species; AAS, amino acid sequence, all species); tree inference RAxML fast mode (-f E), model GTRCAT (or PROTCATJTTF) without or with NNI improvement under GTRGAMMA (PROTGAMMAJTTF) RAxML(-f J). In (B), we compared the rate of change of average per-site likelihood (blue) with the tree topology convergence (red; average Robinson–Foulds distances of ten trees), and the convergence of average trees from neighboring data points (green; Robinson–Foulds distance; e.g., average tree n compared with average tree n + 1,…). The rate of change of average per-site likelihood depends on the allowed-missing data in the alignments. The rate of change of average per-site likelihood can be computed fast (single inference per alignment) as compared with tree topology convergences (multiple inferences) and predicts an optimal number of allowed gaps per column in 3′-UTR multiple sequence alignments of about 100 missing species per pattern. (C) Influence of mixing 3′-UTR and CDS (coding sequences) on the resulting tree topology. Adding relatively small amounts of 3′-UTR to CDS had already a strong impact on the resulting tree topologies (red line), whereas adding small amounts of CDS to 3′-UTR had a much lower impact on the resulting tree (blue line). Note that both curves are different from the diagonal. (D) The 3′-UTRs of avian genes contain evolutionary signals that distinguish order- and family-level taxa. The similarity of the presence of transcription factor binding site motifs (TFBS) in 3′-UTRs of species decreases with increasing evolutionary distance between avian families. Shown are correlations (Z values) of the abundance of TFBS in 3′-UTRs of 97 randomly selected genes expressed in the passerine family Estrildidae versus Fringillidae, versus Basal Oscine families, versus family-level taxa of the order Charadriiformes, and the order Caprimulgiformes. The correlation of TFBS abundance between Charadriiformes and Caprimulgiformes (not shown) is _R_2=0.694. For the list of analyzed genes and species see supplementary table S3, Supplementary Material online.
Fig. 2.
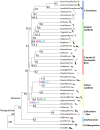
Order-level phylogeny of the birds resulting from the analysis of 3′-UTRs of 221 avian family-level taxa including 379 genera and 429 species (see fig. 3_A_ and B for all families; supplementary fig. S6, Supplementary Material online for all species). In contrast to all previous phylogenies spanning the entire avian class, the statistical support values are high throughout, that is, the approximate likelihood-based measures of branch supports were maximal (SH-aLRT=100) in most cases, except for four branching points (red values). If we reduced the number of missing samples (gappiness) from 110 to 100, the support levels of these four branching points dropped (blue values), whereas all others remained maximal. In case of SH-aLRT values <100, we provide the support values from IQTREE2 ultrafast bootstrapping (green values). The tree is subdivided into seven higher-level clades, the Palaeognathae, the Galloanserae, the Mirandornithes, the Basal Landbirds, the Aquatic & Semiaquatic Birds, the Higher Landbirds, and the Australaves. Particular colors indicate each of the seven avian higher-level clades in all phylogenetic trees of the study. Thus, trivial names (Basal Landbirds, Higher Landbirds, Aquatic & Semiaquatic Birds) used in previous publications and in the current paper comprise different sets of bird order- and family-level taxa. Note that the hoatzin (Opisthocomiformes) resulted as the sister group of the Caprimulgiformes and that the flamingos (Phoenicopteriformes) and grebes (Podicipediformes) form the sister group Mirandornithes of all other Neoaves in our analysis. Black numbers at the nodes are the calculated divergence times of the order-level taxa in million years ago (Ma). Most of the extant order-level taxa evolved in the Paleocene, the other two during early Eocene and some lineages, likely, diverged already before the K-Pg 66 Ma boundary. For illustration purpose, the branch lengths are not scaled. Bird pictures are reproduced with permission of Lynx Edition.
Fig. 3.
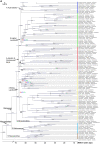
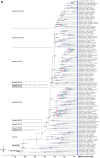
A family-level phylogeny of birds based on 3′-UTR sequences including all (106) nonpasserine (A) and most (115) passerine (B) family-level taxa. For simplicity, each of the families is represented by one species, listed as the species name, followed by the family name and the order name. In (A), the family-level taxa of the seven higher-level clades, the Palaeognathae, the Galloanserae, the Mirandornithes, the Basal Landbirds, the Aquatic & Semiaquatic Birds, the Higher Landbirds, and the Australaves are shown. The higher-level clades are color-coded as in figure 2. Of the Passeriformes (B), the suborders Acanthisitti (New Zealand wrens), Tyranni (suboscines), and Passeri (oscines or songbirds) are indicated and the Passeri is subdivided into ten oscine higher-level clades (OHCs). The tree was calculated by RAxML-ng using a large concatenated alignment of 3′-UTR residues as input (2,584,785 analyzable patterns, maximum 100 or 110 missing taxa [gappiness]). Approximate likelihood-based measures of branch support delivered maximal values (SH-aLRT=100) except those shown in red (for 110-gappiness) and blue (for 100-gappiness). SH-aLRT values are considered as quite conservative. In case of SH-aLRT values <100, we also provide support values from IQTREE2 ultrafast bootstrapping (UFBS, green values). In the few cases were SH-aLRT support was <80 (two for 110-gappiness; seven for 100-gappiness), the UFBS approach still reached good values of support in the range of 86–99. The timing of the branching points was calculated by DPPDiv. The entire tree including all 429 species is provided in supplementary figure S6, Supplementary Material online. Error bars are confidence intervals (95%). Time scale and divergence times are in million years ago. Diagonal bars indicate the part of the tree that is not scaled in order to reduce the size of the tree and the PDF.
Fig. 3.
continued
Fig. 4.
The diversification of oscine passerine families (red) contrasts with that of suboscine passerine families (green) and of nonpasserine families (blue) after the early Miocene epoch. The numbers of new family-level taxa per million year (My) were calculated from the family-level phylogeny according to intervals of 5 My. After the K-Pg boundary (66 Ma), during the Paleocene and early Eocene most neognath order-level taxa emerged with a rather steady rate of new family-level taxa per My (“1”). During the Oligocene epoch, a major diversification event occurred (“2”), which concerned both nonpasserine and passerine family-level taxa (50 families of 12 orders), the highest diversification rate of new family-level clades (3.0 nonpasserine and 2.0 passerine family-level clades/My) taking place between 35 and 25 Ma during the Rupelian and Chattian stages. A third major diversification event (“3”) concerned mainly passerine family-level taxa, having a peak 25–15 Ma in the Aquitanian and Burdigalian stages of the early Miocene (1.6 nonpasserine, 7.1 passerine families/My). Since the Miocene, the radiation of oscine family-level taxa contrasts negatively with diversification rates of nonoscine passerine (New Zealand wrens and suboscines) and nonpasserine families. Arrows indicate the calculated emergence of family-level taxa that evolved vocal learning, the parrots (a), the passerines (b), and the hummingbirds (c). The divergence times of family-level clades were calculated with DPPDiv applying the uncorrected gamma-distributed rate model (see fig. 3_A_ and B;supplementary fig. S6, Supplementary Material online).
Similar articles
- Higher-order phylogeny of modern birds (Theropoda, Aves: Neornithes) based on comparative anatomy. II. Analysis and discussion.
Livezey BC, Zusi RL. Livezey BC, et al. Zool J Linn Soc. 2007 Jan 1;149(1):1-95. doi: 10.1111/j.1096-3642.2006.00293.x. Zool J Linn Soc. 2007. PMID: 18784798 Free PMC article. - More taxa, more characters: the hoatzin problem is still unresolved.
Sorenson MD, Oneal E, Garcia-Moreno J, Mindell DP. Sorenson MD, et al. Mol Biol Evol. 2003 Sep;20(9):1484-98. doi: 10.1093/molbev/msg157. Epub 2003 May 30. Mol Biol Evol. 2003. PMID: 12777516 - Why Do Phylogenomic Data Sets Yield Conflicting Trees? Data Type Influences the Avian Tree of Life more than Taxon Sampling.
Reddy S, Kimball RT, Pandey A, Hosner PA, Braun MJ, Hackett SJ, Han KL, Harshman J, Huddleston CJ, Kingston S, Marks BD, Miglia KJ, Moore WS, Sheldon FH, Witt CC, Yuri T, Braun EL. Reddy S, et al. Syst Biol. 2017 Sep 1;66(5):857-879. doi: 10.1093/sysbio/syx041. Syst Biol. 2017. PMID: 28369655 - Re-evaluating vocal production learning in non-oscine birds.
Ten Cate C. Ten Cate C. Philos Trans R Soc Lond B Biol Sci. 2021 Oct 25;376(1836):20200249. doi: 10.1098/rstb.2020.0249. Epub 2021 Sep 6. Philos Trans R Soc Lond B Biol Sci. 2021. PMID: 34482726 Free PMC article. Review. - Phylogenetics of modern birds in the era of genomics.
Edwards SV, Bryan Jennings W, Shedlock AM. Edwards SV, et al. Proc Biol Sci. 2005 May 22;272(1567):979-92. doi: 10.1098/rspb.2004.3035. Proc Biol Sci. 2005. PMID: 16024355 Free PMC article. Review.
Cited by
- Multi-genome comparisons reveal gain-and-loss evolution of anti-Mullerian hormone receptor type 2 as a candidate master sex-determining gene in Percidae.
Kuhl H, Euclide PT, Klopp C, Cabau C, Zahm M, Lopez-Roques C, Iampietro C, Kuchly C, Donnadieu C, Feron R, Parrinello H, Poncet C, Jaffrelo L, Confolent C, Wen M, Herpin A, Jouanno E, Bestin A, Haffray P, Morvezen R, de Almeida TR, Lecocq T, Schaerlinger B, Chardard D, Żarski D, Larson WA, Postlethwait JH, Timirkhanov S, Kloas W, Wuertz S, Stöck M, Guiguen Y. Kuhl H, et al. BMC Biol. 2024 Jun 26;22(1):141. doi: 10.1186/s12915-024-01935-9. BMC Biol. 2024. PMID: 38926709 Free PMC article. - A juvenile bird with possible crown-group affinities from a dinosaur-rich Cretaceous ecosystem in North America.
Brownstein CD. Brownstein CD. BMC Ecol Evol. 2024 Feb 9;24(1):20. doi: 10.1186/s12862-024-02210-9. BMC Ecol Evol. 2024. PMID: 38336630 Free PMC article. - Keys to the avian Haemoproteus parasites (Haemosporida, Haemoproteidae).
Valkiūnas G, Iezhova TA. Valkiūnas G, et al. Malar J. 2022 Sep 19;21(1):269. doi: 10.1186/s12936-022-04235-1. Malar J. 2022. PMID: 36123731 Free PMC article. Review. - A chromosome-level reference genome and pangenome for barn swallow population genomics.
Secomandi S, Gallo GR, Sozzoni M, Iannucci A, Galati E, Abueg L, Balacco J, Caprioli M, Chow W, Ciofi C, Collins J, Fedrigo O, Ferretti L, Fungtammasan A, Haase B, Howe K, Kwak W, Lombardo G, Masterson P, Messina G, Møller AP, Mountcastle J, Mousseau TA, Ferrer Obiol J, Olivieri A, Rhie A, Rubolini D, Saclier M, Stanyon R, Stucki D, Thibaud-Nissen F, Torrance J, Torroni A, Weber K, Ambrosini R, Bonisoli-Alquati A, Jarvis ED, Gianfranceschi L, Formenti G. Secomandi S, et al. Cell Rep. 2023 Jan 31;42(1):111992. doi: 10.1016/j.celrep.2023.111992. Epub 2023 Jan 19. Cell Rep. 2023. PMID: 36662619 Free PMC article. - Accurate, scalable, and fully automated inference of species trees from raw genome assemblies using ROADIES.
Gupta A, Mirarab S, Turakhia Y. Gupta A, et al. bioRxiv [Preprint]. 2024 Jun 1:2024.05.27.596098. doi: 10.1101/2024.05.27.596098. bioRxiv. 2024. PMID: 38854139 Free PMC article. Preprint.
References
- Aggerbeck M, Fjeldsa J, Christidis L, Fabre PH, Jonsson KA.. 2014. Resolving deep lineage divergences in core corvoid passerine birds supports a proto-Papuan island origin. Mol Phylogenet Evol. 70:272–285. - PubMed
- Armstrong EA. 1963. A study of bird song. London: Oxford University Press.
Publication types
MeSH terms
Substances
LinkOut - more resources
Full Text Sources
Other Literature Sources
Research Materials


