Supersized Ribosomal RNA Expansion Segments in Asgard Archaea - PubMed (original) (raw)
Comparative Study
. 2020 Oct 1;12(10):1694-1710.
doi: 10.1093/gbe/evaa170.
Affiliations
- PMID: 32785681
- PMCID: PMC7594248
- DOI: 10.1093/gbe/evaa170
Comparative Study
Supersized Ribosomal RNA Expansion Segments in Asgard Archaea
Petar I Penev et al. Genome Biol Evol. 2020.
Abstract
The ribosome's common core, comprised of ribosomal RNA (rRNA) and universal ribosomal proteins, connects all life back to a common ancestor and serves as a window to relationships among organisms. The rRNA of the common core is similar to rRNA of extant bacteria. In eukaryotes, the rRNA of the common core is decorated by expansion segments (ESs) that vastly increase its size. Supersized ESs have not been observed previously in Archaea, and the origin of eukaryotic ESs remains enigmatic. We discovered that the large ribosomal subunit (LSU) rRNA of two Asgard phyla, Lokiarchaeota and Heimdallarchaeota, considered to be the closest modern archaeal cell lineages to Eukarya, bridge the gap in size between prokaryotic and eukaryotic LSU rRNAs. The elongated LSU rRNAs in Lokiarchaeota and Heimdallarchaeota stem from two supersized ESs, called ES9 and ES39. We applied chemical footprinting experiments to study the structure of Lokiarchaeota ES39. Furthermore, we used covariation and sequence analysis to study the evolution of Asgard ES39s and ES9s. By defining the common eukaryotic ES39 signature fold, we found that Asgard ES39s have more and longer helices than eukaryotic ES39s. Although Asgard ES39s have sequences and structures distinct from eukaryotic ES39s, we found overall conservation of a three-way junction across the Asgard species that matches eukaryotic ES39 topology, a result consistent with the accretion model of ribosomal evolution.
Keywords: Asgard; archaea; expansion segments; ribosomal RNA.
© The Author(s) 2020. Published by Oxford University Press on behalf of the Society for Molecular Biology and Evolution.
Figures
Fig. 1.
Secondary structures of the LSU rRNA from Bacteria, Archaea, and Eukarya. (A) E. coli (Bacteria), (B) S. cerevisiae (fungus, Eukarya); (C) P. furiosus (Archaea); (D) D. melanogaster (insect, Eukarya); (E) Lokiarchaeota B5 (Archaea); (F) H. sapiens (primate, Eukarya). Secondary structures in panels A_–_D and F are taken from Petrov et al. (2014a). Secondary structure in panel E is from this study. Universal rRNA common core is shown in blue lines (not shaded). ES9 is green. ES39 is magenta. Helices in panel E are abbreviated as Helix 1 (H1), helix 98 (H98), helix a (H_a_), helix a1 (H_a1_), helix a2 (H_a2_), and helix b (H_b_). ESs and helices not present in the common core are shaded in gray. Sizes of secondary structures are to scale. The numbering scheme of Noller et al. (1981) and Leffers et al. (1987) was used to label the helices and ESs.
Fig. 2.
Distribution of ES39 lengths for species within each of the three domains of life, with incorporating Asgard archaea. The number of nucleotides was calculated between alignment positions 4891 and 5123 (H. sapiens numbering) of the LSU alignment for each species (supplementary data set S1, Supplementary Material online). The box shows the quartiles of the data set. Whiskers extend to show the rest of the distribution, except for points that are determined to be outliers using a function of the interquartile range. Bacteria sequences are gray, Lokiarchaeota sequences are green, other Asgard sequences are blue, other archaeal sequences are purple, eukaryotic sequences are red, and sequences from metatranscriptomic contigs (supplementary data set S2, Supplementary Material online) for which there is no species determination are black. Ec, Escherichia coli; Dm, Drosophila melanogaster; Fa, Freyarchaeota; Ha B18, Heimdallarchaeota B18G1; Ha RS, Heimdallarchaeota RS678; Hi, Hexamita inflata; Hs, Homo sapiens; La B5, Lokiarchaeota B5; La GC, Lokiarchaeota GC14_75; Oa, Odinarchaeota LCB4; Pf, Pyrococcus furiosus; Ps, Prometheoarchaeum syntropicum; Sc, Saccharomyces cerevisiae; Ta, Thorarchaeota; Tb, Trypanosoma brucei. *Parasitic representatives of the deeply branching eukaryotic group Excavata. †Excluding the Asgard superphylum.
Fig. 3.
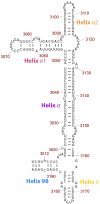
Secondary structure model of ES39 from Lokiarchaeota B5. ES39 spans nucleotide positions 3,006–3,196 of the Lokiarchaeota B5 LSU rRNA. Canonical base-pairing positions are indicated with black lines. Helices are annotated with colored labels: blue—Helix 98, purple—Helix a, pink—Helix a1, orange—Helix a2, gold—Helix b. This figure was generated with RiboVision (Bernier et al. 2014).
Fig. 4.
Secondary structure of Lokiarchaeota B5 ES39 from experiment and computation. (A) 1D topology map of base pairs. The primary sequence of ES39 is on the horizontal. Arcs indicate base pairs. Each helix is a distinct color. (B) SHAPE reactivity for ES39 mapped onto the secondary structure. Darker color indicates less flexible (paired) rRNA. (C) Base pairing conservation within the Asgard superphylum mapped on the secondary structure. Darker color indicates covarying (paired) rRNA across Asgard. Unpaired rRNA, for which no covariation data can be calculated, is gold. (D) SHAPE reactivity and base-pairing conservation mapped onto the ES39 MSA of Asgard sequences. Lokiarchaeota B5 numbering was used. The secondary structure is indicated with colored arrows below the alignment and as colored background. SHAPE reactivity is indicated with a bar graph above the secondary structure annotation, colors of the bars are consistent with panel B. Base-pairing conservation is indicated with a bar graph below the secondary structure annotation; colors of the bars are consistent with panel C. Panel D was generated with Jalview (Waterhouse et al. 2009). Helices are labeled with colored text in each panel; blue, helix 98; violet, helix a; pink, helix a1; orange, helix a2; yellow, helix b. Full sequence names and sequencing project identifiers are available in supplementary data set S2, Supplementary Material online. Both SHAPE reactivity and covariation are normalized. *Positions of conserved GNRA tetraloops.
Fig. 5.
ES39 secondary structures mapped on Asgard phylogeny. Secondary structures of P. furiosus (Archaea), Lokiarchaeota B5 (Asgard archaea), _P. syntropicum (Asgard archaea), Thorarchaeota (Asgard archaea), Odinarchaeota LCB4 (Asgard archaea), Heimdallarchaeota B18 G1 and RS678 (Asgard archaea), T. thermophila (Eukarya), and H. sapiens (Eukarya). Helix abbreviations are the same as in figure 1_E. Helices 98 and b are highlighted in orange. The phylogenetic tree topology is from Williams et al. (2020). Ancestral clades on the phylogenetic tree are labeled as LAECA, Last Archaeal and Eukaryotic Common Ancestor; LAsECA, Last Asgardian and Eukaryotic Common Ancestor; LECA, Last Eukaryotic Common Ancestor; LHaCA, Last Heimdallarchaeota Common Ancestor; LLaCA, Last Lokiarchaeal Common Ancestor; LOTCA, Last Odin- and Thor-archaeota Common Ancestor. Likely ancestral structures are indicated next to ancestral clades. The minimal common structure from related extant species is shown with bold dashes. The uncertainty in ancestral sizes of helix a are shown with light dashes. *Occurrence of strand dissociation in ES39 at LECA due to loss of helix 1 is indicated with a red gradient.
Fig. 6.
3D structures of ES39 and its neighborhood from representative species of the major life domains and Asgard archaea. (A) E. coli (Bacteria), (B) P. furiosus (Archaea), (C) Asgard archaea, and (D) H. sapiens (Eukarya). Helices are abbreviated as helix 1 (H1), helix 94 (H94), helix 98 (H98), helix 99 (H99), and helix b (H_b_). Helix 98 is orange, helix 1 is green, helices 94 and 99 are blue. The P. furiosus structure is used as model for the Asgard structures. Likely structure of Asgard helices 98 and b are shown with backbone trace. The likely position and direction of the Asgard ES39 continuation is indicated with a black dashed line. The direction of eukaryotic ES39 continuation is indicated with a black dashed line.
Fig. 7.
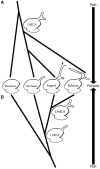
Two scenarios of ES39 evolution illustrated by the tree of life topology. (A) Parallel independent growth of the ES39 region between Asgard archaea and Eukarya with a three-helical ES39 in LAECA. (B) Shared ancestry of three-helical ES39 between Asgard and Eukarya. Ribosomes of extant species are shown in the middle and past phylogenetic relationships extend up and down following the two scenarios. ES sizes are exaggerated for illustrative purposes.
Similar articles
- Metagenomes from Coastal Marine Sediments Give Insights into the Ecological Role and Cellular Features of _Loki_- and Thorarchaeota.
Manoharan L, Kozlowski JA, Murdoch RW, Löffler FE, Sousa FL, Schleper C. Manoharan L, et al. mBio. 2019 Sep 10;10(5):e02039-19. doi: 10.1128/mBio.02039-19. mBio. 2019. PMID: 31506313 Free PMC article. - Coevolution of Eukaryote-like Vps4 and ESCRT-III Subunits in the Asgard Archaea.
Lu Z, Fu T, Li T, Liu Y, Zhang S, Li J, Dai J, Koonin EV, Li G, Chu H, Li M. Lu Z, et al. mBio. 2020 May 19;11(3):e00417-20. doi: 10.1128/mBio.00417-20. mBio. 2020. PMID: 32430468 Free PMC article. - Anomalous Phylogenetic Behavior of Ribosomal Proteins in Metagenome-Assembled Asgard Archaea.
Garg SG, Kapust N, Lin W, Knopp M, Tria FDK, Nelson-Sathi S, Gould SB, Fan L, Zhu R, Zhang C, Martin WF. Garg SG, et al. Genome Biol Evol. 2021 Jan 7;13(1):evaa238. doi: 10.1093/gbe/evaa238. Genome Biol Evol. 2021. PMID: 33462601 Free PMC article. - Asgard archaea: Diversity, function, and evolutionary implications in a range of microbiomes.
MacLeod F, Kindler GS, Wong HL, Chen R, Burns BP. MacLeod F, et al. AIMS Microbiol. 2019 Jan 30;5(1):48-61. doi: 10.3934/microbiol.2019.1.48. eCollection 2019. AIMS Microbiol. 2019. PMID: 31384702 Free PMC article. Review. - Mythical origins of the actin cytoskeleton.
Akıl C, Kitaoku Y, Tran LT, Liebl D, Choe H, Muengsaen D, Suginta W, Schulte A, Robinson RC. Akıl C, et al. Curr Opin Cell Biol. 2021 Feb;68:55-63. doi: 10.1016/j.ceb.2020.08.011. Epub 2020 Oct 10. Curr Opin Cell Biol. 2021. PMID: 33049465 Review.
Cited by
- Asgard archaea defense systems and their roles in the origin of eukaryotic immunity.
Leão P, Little ME, Appler KE, Sahaya D, Aguilar-Pine E, Currie K, Finkelstein IJ, De Anda V, Baker BJ. Leão P, et al. Nat Commun. 2024 Jul 31;15(1):6386. doi: 10.1038/s41467-024-50195-2. Nat Commun. 2024. PMID: 39085212 Free PMC article. - Chapter 5: Major Biological Innovations in the History of Life on Earth.
Bozdag GO, Szeinbaum N, Conlin PL, Chen K, Fos SM, Garcia A, Penev PI, Schaible GA, Trubl G. Bozdag GO, et al. Astrobiology. 2024 Mar;24(S1):S107-S123. doi: 10.1089/ast.2021.0119. Astrobiology. 2024. PMID: 38498818 - Ribosomal Protein Cluster Organization in Asgard Archaea.
Tirumalai MR, Sivaraman RV Jr, Kutty LA, Song EL, Fox GE. Tirumalai MR, et al. Archaea. 2023 Sep 29;2023:5512414. doi: 10.1155/2023/5512414. eCollection 2023. Archaea. 2023. PMID: 38314098 Free PMC article. - Ancestry of RNA/RNA interaction regions within segmented ribosomes.
Rivas M, Fox GE. Rivas M, et al. RNA. 2023 Sep;29(9):1388-1399. doi: 10.1261/rna.079654.123. Epub 2023 Jun 1. RNA. 2023. PMID: 37263782 Free PMC article. - The Importance of Being RNA-est: considering RNA-mediated ribosome plasticity.
Trahan C, Oeffinger M. Trahan C, et al. RNA Biol. 2023 Jan;20(1):177-185. doi: 10.1080/15476286.2023.2204581. RNA Biol. 2023. PMID: 37098839 Free PMC article.
References
- Agmon I, Bashan A, Zarivach R, Yonath A. 2005. Symmetry at the active site of the ribosome: structural and functional implications. Biol Chem. 386(9):833–844. - PubMed
- Ajuh PM, Heeney PA, Maden BE. 1991. Xenopus borealis and Xenopus laevis 28S ribosomal DNA and the complete 40S ribosomal precursor RNA coding units of both species. Proc Royal Soc B 245(1312):65–71. - PubMed
- Akıl C, Robinson RC. 2018. Genomes of Asgard archaea encode profilins that regulate actin. Nature 562(7727):439–443. - PubMed
- Altschul SF, Gish W, Miller W, Myers EW, Lipman DJ. 1990. Basic local alignment search tool. J Mol Biol. 215(3):403–410. - PubMed
- Andrews S. 2012. FastQC: a quality control tool for high throughput sequence data. Available from: https://www.bioinformatics.babraham.ac.uk/projects/fastqc/. Accessed August 21, 2020.
Publication types
MeSH terms
Substances
LinkOut - more resources
Full Text Sources
Miscellaneous


