Interplay of m6A and H3K27 trimethylation restrains inflammation during bacterial infection - PubMed (original) (raw)
Interplay of m6A and H3K27 trimethylation restrains inflammation during bacterial infection
Chenglei Wu et al. Sci Adv. 2020.
Abstract
While N 6-methyladenosine (m6A) is the most prevalent modification of eukaryotic messenger RNA (mRNA) involved in various cellular responses, its role in modulating bacteria-induced inflammatory response remains elusive. Here, we showed that loss of the m6A reader YTH-domain family 2 (YTHDF2) promoted demethylation of histone H3 lysine-27 trimethylation (H3K27me3), which led to enhanced production of proinflammatory cytokines and facilitated the deposition of m6A cotranscriptionally. Mechanistically, the mRNA of lysine demethylase 6B (KDM6B) was m6A-modified and its decay mediated by YTHDF2. YTHDF2 deficiency stabilized KDM6B to promote H3K27me3 demethylation of multiple proinflammatory cytokines and subsequently enhanced their transcription. Furthermore, we identified H3K27me3 as a barrier for m6A modification during transcription. KDM6B recruits the m6A methyltransferase complex to facilitate the methylation of m6A in transcribing mRNA by removing adjacent H3K27me3 barriers. These results revealed cross-talk between m6A and H3K27me3 during bacterial infection, which has broader implications for deciphering epitranscriptomics in immune homeostasis.
Copyright © 2020 The Authors, some rights reserved; exclusive licensee American Association for the Advancement of Science. No claim to original U.S. Government Works. Distributed under a Creative Commons Attribution NonCommercial License 4.0 (CC BY-NC).
Figures
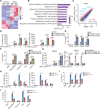
Fig. 1. YTHDF2 deficiency enhances bacteria-induced inflammatory responses.
(A) Heatmap of RNA-seq analysis showing differently expressed genes in WT versus YTHDF2 KO THP-1 cells in response to HKST. (B) GO enrichment analysis of genes with substantially up-regulated transcription in YTHDF2 KO THP-1 cells than that in WT THP-1 cells after treatment with HKST. (C) Scatterplot shows that IL6, IL12B, CCL22, and _ICAM1_are among the most notably up-regulated genes in YTHDF2 KO THP-1 cells versus WT THP-1 cells. (D) WT or YTHDF2 KO THP-1 cells were infected with HKST for indicated periods, and then IL6 and IL12B mRNA expressions were analyzed. (E) WT or YTHDF2 KO THP-1 cells were exposed to HKST, HKLM, or HKEB, and then the production of IL-6 was measured by ELISAs. (F) WT or YTHDF2 KO THP-1 cells were stimulated with Pam3CSK4 (100 ng/ml), poly(I:C) (10 μg/ml), LPS (200 ng/ml), or CL097 (1 μg/ml) for 24 hours, and then the production of IL-6 was measured by ELISAs. (G) PBMCs that were transfected with YTHDF2 siRNA or control siRNA for 48 hours were stimulated with HKST for indicated periods, and then IL6 and YTHDF2 mRNA expressions were analyzed. (H) THP-1EV and THP-1YTHDF2 cells were stimulated with HKST for indicated periods, and then IL6 and IL12B mRNA expressions were analyzed. (I) THP-1EV and THP-1YTHDF2 cells were infected with HKST, HKLM, or HKEB for 24 hours, and the production of IL-6 was analyzed by ELISAs. (J) THP-1EV and THP-1YTHDF2 cells were treated with LPS, poly(I:C), Pam3CSK4, or CL097 for 24 hours before the supernatants were collected. The production of IL-6 was analyzed by ELISAs. Data in (D) to (J) are presented as means ± SEM combined from three independent experiments with triplicate; ns, not significant, *P < 0.05, **P < 0.01, and ***P < 0.001 compared with control cells. STAT, signal transducers and activators of transcription.
Fig. 2. m6A level of histone modification–related genes is increased during bacterial infection.
(A) A structural diagram of WT YTHDF2 as well as schematic representation of truncation mutants and m6A recognition site mutations of YTHDF2. The numbers indicate amino acid positions. (B) The constructed YTHDF2 (WT) as well as YTHDF2 truncations (N and C termini) or site mutation (WA) THP-1 cell lines were exposed to HKST for 24 hours, and then the production of IL-6 was measured by ELISAs. (C) Sequence motif was identified within m6A peaks by HOMER analysis of WT and YTHDF2 KO THP-1 cells with or without HKST treatment. (D) Pie charts depicting the proportion of m6A peak distribution in the 5′UTR, CDS, and 3′UTR regions across mRNA transcriptome. (E) Metagene profiles of m6A peak distribution across the 5′UTR, CDS, and 3′UTR in THP-1 cells with or without HKST treatment. (F) Scatterplot showing the m6A peaks in mRNA of HKST-treated and untreated THP-1 cells. The abundance of m6A peaks was calculated as enrichment fold (EF; immunoprecipitate/input) from the m6A-seq data. The m6A-containing transcripts with notably increased and decreased peaks are highlighted in red and blue, respectively. (G) GO analysis of the genes that contained hypermethylated m6A peaks in HKST-infected THP-1 cells versus the uninfected cells. MeRIP-seq, m6Aspecific methylated RNA immunoprecipitation combined with high-throughput sequencing. (H) GO analysis of a group of overlapped genes that bound to YTHDF2 based on the YTHDF2 RIP-seq data and contained hypermethylated m6A peaks after exposure to HKST in THP-1 cells.
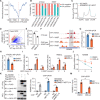
Fig. 3. YTHDF2 inhibits H3K27me3 demethylation of IL6 promoter.
(A) WT and YTHDF2 KO THP-1 cells were infected with HKST for indicated periods, and then the nuclear extracts were subjected to immunoblot analysis with the indicated antibodies. IB, immunoblot. (B) IGV browser tracks show the distribution of H3K27me3 ChIP-seq signals at indicated loci in WT and YTHDF2 KO THP-1 cells stimulated with HKST. (C and D) ChIP-qPCR assay for H3K27me3 and H3K4me3 at the IL6, IL12B, CCL22, or ICAM1 promoter region in WT and YTHDF2 KO THP-1 cells infected with HKST or not. (E) WT and KDM6B KO THP-1 cells were exposed to HKST for indicated periods, and then the nuclear extracts were analyzed by immunoblotting with the indicated antibodies. (F) ChIP-qPCR assay for H3K27me3 and H3K4me3 at the IL-6 promoter region in WT, KDM6B KO, YTHDF2 KO, or YTHDF2 and KDM6B double knockout (dKO) THP-1 cells in response to HKST. (G) WT, YTHDF2 KO, KDM6B KO, or YTHDF2 and KDM6B dKO THP-1 cells were infected with HKST for 24 hours, and supernatants were collected to analyze the production of IL-6 by ELISAs. Data in (A) and (E) are representative of three individual experiments with similar results. Data in (C), (D), (F), and (G) are presented as means ± SEM combined from three independent experiments with triplicate; *P < 0.05, **P < 0.01, and ***P < 0.001 compared with control cells (Student’s t test). ns, not significant.
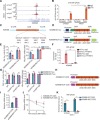
Fig. 4. YTHDF2 degrades KDM6B mRNA via an m6A-dependent manner.
(A) IGV tracks displaying YTHDF2 RIP-seq (top) and RNA-seq (bottom) read distribution in KDM6B mRNA of WT and YTHDF2 KO THP-1 cells with HKST infection. (B) RIP-qPCR detecting the binding of YTHDF2 to the transcripts of KDM6B in THP-1 cells stimulated with and without HKST. (C) The expression of KDM6B analyzed by RT-PCR increased in YTHDF2 KO versus WT THP-1 cells after infection with HKST for indicated periods. (D) Immunoblot analysis of KDM6B in WT and YTHDF2 KO THP-1 cells exposed to HKST for indicated periods. (E) PBMCs were transfected with YTHDF2 or control siRNA for 48 hours and then treated with HKST, and KDM6B transcription was analyzed by real-time PCR. (F) Representative mRNA profile of KDM6B at indicated time points after actinomycin D (5 μg/ml) treatment in WT and YTHDF2 KO THP-1 infected with HKST. (G) RIP-qPCR detecting the binding region of YTHDF2 to the mRNA of KDM6B in THP-1 cell lines that overexpressed Flag-tagged YTHDF2 (WT) as well as YTHDF2 truncations (N and C termini) or site mutation (WA) exposed to HKST. (H) THP-1EV, THP-1YTHDF2-WT, THP-1YTHDF2-N, THP-1YTHDF2-C (left), and THP-1YTHDF2-WA (right) cells were stimulated with HKST for indicated periods, and then KDM6B expression was analyzed by real-time PCR. Data in (D) are representative of three individual experiments with similar results. Data in (B), (C), and (E) to (H) are presented as means ± SEM combined from three independent experiments with triplicate, *P < 0.05, **P < 0.01, and ***P < 0.001 compared with control cells.
Fig. 5. Identification of specific m6A modification sites in KDM6B mRNA.
(A) IGV browser tracks showing that m6A peaks were enriched in the CDS of the KDM6B transcript from the m6A-seq data. IP, immunoprecipitation. (B) m6A-qPCR analysis of KDM6B mRNA in WT THP-1 cells with or without HKST infection. (C) Schematic representation of the position of m6A motifs within the KDM6B transcript. (D) Schematic diagram of KDM6B WT (_KDM6B_-WT-luc) and KDM6B mutant (_KDM6B_-MUT-luc) reporters. The 690-nt DNA sequence of the WT KDM6B segment sequence was inserted to the dual-luciferase reporter plasmid to give rise to the _KDM6B_-WT-luc reporter. For the _KDM6B_-MUT-luc, A–C substitutions were made within the m6A consensus. (E) Relative dual-luciferase reporter activity and mRNA level of WT (_KDM6B_-WT-luc) or mutated (_KDM6B_-MUT-luc) reporters in HeLa cells with ectopically expressed YTHDF2. (F) RIP-qPCR detecting the binding of YTHDF2 to the transcripts of _KDM6B_-WT-luc or _KDM6B_-MUT-luc reporter in HeLa cells. (G) Relative dual-luciferase reporter activity and mRNA level of WT (_KDM6B_-WT) or mutated (_KDM6B_-MUT) reporters in WT or YTHDF2 KO HeLa cells. (H) Schematic depiction of mutation of the m6A site in the KDM6B CDS region. (I and J) Full-length WT or mutant (MUT) KDM6B CDS regions were ectopically expressed in HeLa cells. After 24 hours, KDM6B mRNA levels were measured by RT-PCR (I), or cells were treated with actinomycin D (5 μg/ml) and total mRNA at indicated time points were collected to analyze the remaining KDM6B mRNA (J). (K) THP-1 cells stably expressing WT or mutant (MUT) KDM6B CDS fragment were infected with HKST for 6 hours, and then the binding of YTHDF2 was detected by RIP-qPCR. Data in (B), (E) to (G), and (I) to (K) are presented as means ± SEM combined from three individual experiments with triplicate. *P < 0.05, **P < 0.01, and ***P < 0.001 compared with control cells.
Fig. 6. KDM6B facilitates m6A deposition by recruiting m6A methyltransferase complex.
(A) Distance of H3K27me3 to the nearest m6A peaks in HKST-infected THP-1 cells. (B) Percentages of m6A peaks in different regions in THP-1 cells with or without HKST infection. The m6A peaks were normalized with exomePeak. (C) Metagene profiles of m6A distribution in WT or KDM6B KO THP-1 cells treated with HKST. (D) Scatterplot of m6A in KDM6B KO or WT THP-1 cells infected with HKST. (E) m6A levels on poly(A) RNA of HKST-stimulated THP-1 cells treated with or without GSK-J4. (F) (Top) Distribution of m6A peaks across the KDM6B mRNA transcript in THP-1 cells treated with or without HKST and (bottom) distribution of H3K27me3 peaks across the KDM6B mRNA transcript in WT and YTHDF2 KO THP-1 cells treated with HKST. (G and H) m6A RIP-qPCR (G) and YTHDF2 RIP-qPCR (H) analyses of KDM6B mRNA in DMSO- or GSK-J4–treated THP-1 cells in response to HKST. (I) KDM6B mRNA expression in HKST-stimulated THP-1 cells or PBMCs with or without GSK-J4 treatment. (J) HKST-stimulated THP-1 cells were treated with DMSO or GSK-J4 for 24 hours, and then total mRNA were collected at 0, 2, or 4 hours after actinomycin D treatment to analyze the remaining KDM6B mRNA. (K) Coimmunoprecipitation of KDM6B and METTL3/14. WCL, whole cell lysate. (L) ChIP and ChIP-re-ChIP analysis of the association of KDM6B and METTL14 with the KDM6B genome DNA in HeLa cells transfected with Flag-tagged KDM6B or/and hemagglutinin (HA)–tagged METTL14. (M) Reduction in METTL14 at KDM6B gene body in HA-tagged METTL14-transfected HeLa cells with or without GSK-J4 treatment. Data in (K) are representative of three individual experiments with similar results. Data in (E), (G) to (J), (L), and (M) are presented as means ± SEM. *P < 0.05, **P < 0.01, and ***P < 0.001 compared with control.
Similar articles
- KDM6 demethylase independent loss of histone H3 lysine 27 trimethylation during early embryonic development.
Shpargel KB, Starmer J, Yee D, Pohlers M, Magnuson T. Shpargel KB, et al. PLoS Genet. 2014 Aug 7;10(8):e1004507. doi: 10.1371/journal.pgen.1004507. eCollection 2014 Aug. PLoS Genet. 2014. PMID: 25101834 Free PMC article. - Histone demethylases Kdm6ba and Kdm6bb redundantly promote cardiomyocyte proliferation during zebrafish heart ventricle maturation.
Akerberg AA, Henner A, Stewart S, Stankunas K. Akerberg AA, et al. Dev Biol. 2017 Jun 1;426(1):84-96. doi: 10.1016/j.ydbio.2017.03.030. Epub 2017 Apr 1. Dev Biol. 2017. PMID: 28372944 Free PMC article. - Vitamin C-dependent lysine demethylase 6 (KDM6)-mediated demethylation promotes a chromatin state that supports the endothelial-to-hematopoietic transition.
Zhang T, Huang K, Zhu Y, Wang T, Shan Y, Long B, Li Y, Chen Q, Wang P, Zhao S, Li D, Wu C, Kang B, Gu J, Mai Y, Wang Q, Li J, Zhang Y, Liang Z, Guo L, Wu F, Su S, Wang J, Gao M, Zhong X, Liao B, Chen J, Zhang X, Shu X, Pei D, Nie J, Pan G. Zhang T, et al. J Biol Chem. 2019 Sep 13;294(37):13657-13670. doi: 10.1074/jbc.RA119.009757. Epub 2019 Jul 24. J Biol Chem. 2019. PMID: 31341023 Free PMC article. - JMJD3 as an epigenetic regulator in development and disease.
Burchfield JS, Li Q, Wang HY, Wang RF. Burchfield JS, et al. Int J Biochem Cell Biol. 2015 Oct;67:148-57. doi: 10.1016/j.biocel.2015.07.006. Epub 2015 Jul 17. Int J Biochem Cell Biol. 2015. PMID: 26193001 Free PMC article. Review. - Therapeutic potential of inhibiting histone 3 lysine 27 demethylases: a review of the literature.
Abu-Hanna J, Patel JA, Anastasakis E, Cohen R, Clapp LH, Loizidou M, Eddama MMR. Abu-Hanna J, et al. Clin Epigenetics. 2022 Aug 1;14(1):98. doi: 10.1186/s13148-022-01305-8. Clin Epigenetics. 2022. PMID: 35915507 Free PMC article. Review.
Cited by
- Elevated WTAP promotes hyperinflammation by increasing m6A modification in inflammatory disease models.
Ge Y, Chen R, Ling T, Liu B, Huang J, Cheng Y, Lin Y, Chen H, Xie X, Xia G, Luo G, Yuan S, Xu A. Ge Y, et al. J Clin Invest. 2024 May 16;134(14):e177932. doi: 10.1172/JCI177932. J Clin Invest. 2024. PMID: 39007267 Free PMC article. - The Role of N6-Methyladenosine in Inflammatory Diseases.
Xu H, Lin C, Yang J, Chen X, Chen Y, Chen J, Guo A, Hu C. Xu H, et al. Oxid Med Cell Longev. 2022 Dec 12;2022:9744771. doi: 10.1155/2022/9744771. eCollection 2022. Oxid Med Cell Longev. 2022. PMID: 36578520 Free PMC article. Review. - Driving Chromatin Organisation through N6-methyladenosine Modification of RNA: What Do We Know and What Lies Ahead?
Selmi T, Lanzuolo C. Selmi T, et al. Genes (Basel). 2022 Feb 12;13(2):340. doi: 10.3390/genes13020340. Genes (Basel). 2022. PMID: 35205384 Free PMC article. Review. - Dynamic DNA 5-hydroxylmethylcytosine and RNA 5-methycytosine Reprogramming During Early Human Development.
Han X, Guo J, Wang M, Zhang N, Ren J, Yang Y, Chi X, Chen Y, Yao H, Zhao YL, Yang YG, Sun Y, Xu J. Han X, et al. Genomics Proteomics Bioinformatics. 2023 Aug;21(4):805-822. doi: 10.1016/j.gpb.2022.05.005. Epub 2022 May 26. Genomics Proteomics Bioinformatics. 2023. PMID: 35644351 Free PMC article. - A New Epigenetic Crosstalk: Chemical Modification Information Flow.
Lee H, Park YJ, Seo PJ. Lee H, et al. Adv Genet (Hoboken). 2023 Jun 27;4(3):2200033. doi: 10.1002/ggn2.202200033. eCollection 2023 Sep. Adv Genet (Hoboken). 2023. PMID: 37766805 Free PMC article.
References
- Medzhitov R., Origin and physiological roles of inflammation. Nature 454, 428–435 (2008). - PubMed
- Takeuchi O., Akira S., Pattern recognition receptors and inflammation. Cell 140, 805–820 (2010). - PubMed
- Barrat F. J., Elkon K. B., Fitzgerald K. A., Importance of nucleic acid recognition in inflammation and autoimmunity. Annu. Rev. Med. 67, 323–336 (2016). - PubMed
- Kawai T., Akira S., The role of pattern-recognition receptors in innate immunity: Update on Toll-like receptors. Nat. Immunol. 11, 373–384 (2010). - PubMed
Publication types
MeSH terms
Substances
LinkOut - more resources
Full Text Sources
Medical


