DNA polymerase α interacts with H3-H4 and facilitates the transfer of parental histones to lagging strands - PubMed (original) (raw)
DNA polymerase α interacts with H3-H4 and facilitates the transfer of parental histones to lagging strands
Zhiming Li et al. Sci Adv. 2020.
Abstract
How parental histones, the carriers of epigenetic modifications, are deposited onto replicating DNA remains poorly understood. Here, we describe the eSPAN method (enrichment and sequencing of protein-associated nascent DNA) in mouse embryonic stem (ES) cells and use it to detect histone deposition onto replicating DNA strands with a relatively small number of cells. We show that DNA polymerase α (Pol α), which synthesizes short primers for DNA synthesis, binds histone H3-H4 preferentially. A Pol α mutant defective in histone binding in vitro impairs the transfer of parental H3-H4 to lagging strands in both yeast and mouse ES cells. Last, dysregulation of both coding genes and noncoding endogenous retroviruses is detected in mutant ES cells defective in parental histone transfer. Together, we report an efficient eSPAN method for analysis of DNA replication-linked processes in mouse ES cells and reveal the mechanism of Pol α in parental histone transfer.
Copyright © 2020 The Authors, some rights reserved; exclusive licensee American Association for the Advancement of Science. No claim to original U.S. Government Works. Distributed under a Creative Commons Attribution NonCommercial License 4.0 (CC BY-NC).
Figures
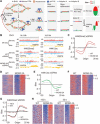
Fig. 1. Development of the eSPAN method to analyze proteins at replication forks in mammalian cells.
(A) A graphic diagram of the eSPAN workflow. Ab, antibody. (B) Snapshots of OK-seq reads density and bias and H4K20me2 and H4K12ac eSPAN reads density and bias in WT and MCM2-2A mouse ES cells at selected initiation zone regions on chromosome 3. Red and blue tracks indicate sequencing reads of Watson (W) and Crick (C) strands, respectively. Bias is calculated using the formula (W − C)/(W + C). (C and E) Average bias of H4K20me2 (C) and H4K12ac (E) eSPAN (n = 1548) in WT and MCM2-2A mouse ES cells with two repeats is shown for each genotype. (D and F) Representative heatmap of H4K20me2 (D) and H4K12ac (F) eSPAN biases in WT and MCM2-2A mouse ES cells at each of the 1548 initiation zones ranking from the most efficient (top) to the least efficient (bottom) ones based on OK-seq bias. (G) Average bias of H4K20me2 eSPAN (n = 1548) in 100 thousand (red) and 50 thousand (black) of WT and MCM-2A mouse ES cells. (H) Representative heatmap of H4K20me2 eSPAN biases in different amounts of WT and MCM2-2A mouse ES cells at each of the 1548 initiation zones ranking from the most efficient (top) to least efficient (bottom) ones.
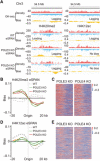
Fig. 2. POLE3 and POLE4 promote the transfer of parental H3-H4 to leading strands in mouse ES cells.
(A) Snapshots of OK-seq reads density and bias and H4K20me2 and H4K12ac eSPAN reads density and bias in WT, POLE3 KO, and POLE4 KO mouse ES cells at selected initiation zones on chromosome 3. (B and D) Average bias of H4K20me2 (B) and H4K12ac (D) eSPAN (n = 1548) in WT, POLE3 KO, and POLE4 KO mouse ES, each with two repeats. (C and E) Representative heatmap of H4K20me2 (C) and H4K12ac (E) eSPAN biases at each of 1548 initiation zones in POLE3 KO and POLE4 KO mouse ES cells. The initiation zones were ranked from the most efficient (top) to the least efficient (bottom).
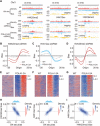
Fig. 3. Mutating the Pol α HBM impairs parental histone transfer to lagging strand in mouse ES cells.
(A) Snapshots of OK-seq reads density and bias and H4K20me2, H4K12ac, and H3K36me3 eSPAN reads density and bias in WT and POLA1-2A mouse ES cells at selected origin regions on chromosome 3. (B to D) Average bias of H4K20me2 (B), H4K12ac (C), and H3K36me3 (D) eSPAN results at selected initiation zones (n = 1548) in WT and POLA1-2A mouse ES cells, each with two repeats shown. (E to G) Representative heatmap of H4K20me2 (E), H4K12ac (F), and H3K36me3 (G) eSPAN in WT and POLA1-2A mouse ES cells. (H) H4K20me2 and H4K12ac eSPAN biases in POLA1-2A mouse ES cells showed a strong anticorrelation and correlation with OK-seq bias, respectively. Spearman’s rank correlation coefficient and the density distribution were shown. (I) H4K20me2 and H4K12ac eSPAN biases in POLA1-2A mouse ES cells showed reverse correlation.
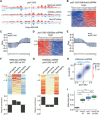
Fig. 4. The Pol1 mutant defective in histone binding shows defects in parental histone transfer to lagging strand in budding yeast.
(A) Snapshot of BrdU-IP-ssSeq, H3K56ac, and H3K4me3 eSPAN peaks surrounding the ARS1309 origin in pol1-2A2 mutant cells. Red and blue tracks represent sequencing reads of Watson and Crick strands, respectively. (B and D) Heatmap representing the bias ratio and pattern of H3K4me3 (B) and H3K56ac (D) eSPAN peaks in pol1-2A2 mutant cells at each of the 20 individual nucleosomes surrounding each of the 134 early DNA replication origins ranked from top to bottom based on replication efficiency. Individual nucleosomes are represented by a circle, and their positions are indicated (−10 to +10), with each row representing one origin. (C and E) The average bias ratio of H3K4me3 (C) and H3K56ac (E) eSPAN peaks in WT and pol1-2A2 mutant cells at each of the 20 individual nucleosomes of the 134 early replication origins. Data were shown as means ± SEM from two independent replicates. (F and G) The relative amount of H3K4me3 (F) and H3K56ac (G) in pol1-2A2 compared to WT strains at each of the 134 origins (heatmap, top) and the average (bottom) of these origins. (H) H3K4me3 eSPAN bias patterns in pol1-2A2 showed a strong correlation with that of mcm2-3A. Spearman’s rank correlation coefficient and the density distribution were shown. (I) Effects of the pol1-2A2 and mcm2-3A mutation alone and in combination on the silencing loss at the HML locus. Data were plotted as means ± SEM from three independent repeats. ***P < 0.001; n.s., not significant; _P_ > 0.05.
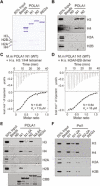
Fig. 5. Pol α preferentially interacts with histone H3-H4 tetramers.
(A and B) In vitro interactions between GST-POLA1 N-terminal fragments and histones. Proteins associated with GST-POLA1 N-terminal fragments were visualized by Coomassie Brilliant Blue (CBB) staining (A) and immunoblotting (B). GST beads and GST Regα were used as negative controls for the assays. (C and D) ITC results using POLA1 N1 fragment and H3.1/H4 tetramer (C) or H2A/H2B dimer (D). Top, raw data; bottom, fitted curves. The N value in (C) (N = 0.48) indicated that one POLA1 N1 molecule binds two copies of H3-H4 dimer (i.e., one tetramer). M.m, Mus musculus; H.s., Home sapiens. (E) Mutations at the HBM of POLA1 reduce its interaction with histone H3-H4. Proteins associated with GST-POLA1 N-terminal fragments were visualized by immunoblotting. GST beads and GST REGα were used as negative controls for the assays. (F) In vitro interactions between yeast GST-Pol1 N-terminal fragments and histones based on GST pull-down assays and Western blot analysis of indicated proteins.
Fig. 6. Cells defective in parental histone transfer show defects in gene transcription and ERV silencing.
(A and B) Cluster analysis of differentially expressed genes between WT and POLA1-2A (A) and MCM2-2A (B) mutant mouse ES cells by RNA-seq. Results from two independent repeats (rep 1 and rep 2) were shown. FPKM, fragments per kilobase of transcript per million mapped reads. (C) Venn diagram of up-regulated (top) and down-regulated (bottom) genes between POLA1-2A and MCM2-2A mutant mouse ES cells. (D and E) Changes in the transcription of transposable elements (TEs) in POLA1-2A (D) and MCM2-2A (E) relative to WT mouse ES cells. Histograms show the distributions of the log2 fold change (LFC) of repeat element expression in each mutant relative to WT cells. Orange, transcription of repetitive elements (Repbase with RNA-seq; POLA1-2A n = 2; MCM2-2A n = 2). Blue, transcription of Ensembl genes. (F) Expression analysis of repetitive elements in WT, POLA1-2A, and MCM2-2A mouse ES cells by quantitative PCR. MMERGLN-int (ERV1), IAPEz-int (ERVK), and MERVL-int (ERVL) representing different families of ERVs were tested. Data were plotted as means ± SEM from at least three independent repeats. **P < 0.01 and ***P < 0.001. (G and H) Changes in the enrichment of H3K9me3 in POLA1-2A (G) and MCM2-2A (H) relative to WT mouse ES cells. Histograms show the distributions of the LFC of H3K9me3 density in POLA1-2A and MCM2-2A mutants relative to WT cells. (I) A model for the role of POLA1 in parental histone transfer.
Similar articles
- A mechanism for preventing asymmetric histone segregation onto replicating DNA strands.
Yu C, Gan H, Serra-Cardona A, Zhang L, Gan S, Sharma S, Johansson E, Chabes A, Xu RM, Zhang Z. Yu C, et al. Science. 2018 Sep 28;361(6409):1386-1389. doi: 10.1126/science.aat8849. Epub 2018 Aug 16. Science. 2018. PMID: 30115745 Free PMC article. - The Mcm2-Ctf4-Polα Axis Facilitates Parental Histone H3-H4 Transfer to Lagging Strands.
Gan H, Serra-Cardona A, Hua X, Zhou H, Labib K, Yu C, Zhang Z. Gan H, et al. Mol Cell. 2018 Oct 4;72(1):140-151.e3. doi: 10.1016/j.molcel.2018.09.001. Epub 2018 Sep 20. Mol Cell. 2018. PMID: 30244834 Free PMC article. - DNA polymerase delta governs parental histone transfer to DNA replication lagging strand.
Tian C, Zhang Q, Jia J, Zhou J, Zhang Z, Karri S, Jiang J, Dickinson Q, Yao Y, Tang X, Huang Y, Guo T, He Z, Liu Z, Gao Y, Yang X, Wu Y, Chan KM, Zhang D, Han J, Yu C, Gan H. Tian C, et al. Proc Natl Acad Sci U S A. 2024 May 14;121(20):e2400610121. doi: 10.1073/pnas.2400610121. Epub 2024 May 7. Proc Natl Acad Sci U S A. 2024. PMID: 38713623 Free PMC article. - How is epigenetic information on chromatin inherited after DNA replication?
Nakatani Y, Tagami H, Shestakova E. Nakatani Y, et al. Ernst Schering Res Found Workshop. 2006;(57):89-96. doi: 10.1007/3-540-37633-x_5. Ernst Schering Res Found Workshop. 2006. PMID: 16568950 Review. - A tale of two strands: Decoding chromatin replication through strand-specific sequencing.
Li Z, Zhang Z. Li Z, et al. Mol Cell. 2025 Jan 16;85(2):238-261. doi: 10.1016/j.molcel.2024.10.035. Epub 2025 Jan 16. Mol Cell. 2025. PMID: 39824166 Review.
Cited by
- Genome-wide measurement of DNA replication fork directionality and quantification of DNA replication initiation and termination with Okazaki fragment sequencing.
Wu X, Liu Y, d'Aubenton-Carafa Y, Thermes C, Hyrien O, Chen CL, Petryk N. Wu X, et al. Nat Protoc. 2023 Apr;18(4):1260-1295. doi: 10.1038/s41596-022-00793-5. Epub 2023 Jan 18. Nat Protoc. 2023. PMID: 36653528 Review. - RTEL1 is required for silencing and epigenome stability.
Olivier M, Hesketh A, Pouch-Pélissier MN, Pélissier T, Huang Y, Latrasse D, Benhamed M, Mathieu O. Olivier M, et al. Nucleic Acids Res. 2023 Sep 8;51(16):8463-8479. doi: 10.1093/nar/gkad610. Nucleic Acids Res. 2023. PMID: 37471026 Free PMC article. - Monitoring and quantifying replication fork dynamics with high-throughput methods.
Fajri N, Petryk N. Fajri N, et al. Commun Biol. 2024 Jun 14;7(1):729. doi: 10.1038/s42003-024-06412-1. Commun Biol. 2024. PMID: 38877080 Free PMC article. Review. - Structure of a histone hexamer bound by the chaperone domains of SPT16 and MCM2.
Gan S, Yang WS, Wei L, Zhang Z, Xu RM. Gan S, et al. Sci China Life Sci. 2024 Jun;67(6):1305-1307. doi: 10.1007/s11427-024-2560-8. Epub 2024 Mar 7. Sci China Life Sci. 2024. PMID: 38478295 Free PMC article. No abstract available. - Replication-coupled inheritance of chromatin states.
Song A, Wang Y, Liu C, Yu J, Zhang Z, Lan L, Lin H, Zhao J, Li G. Song A, et al. Cell Insight. 2024 Aug 23;3(6):100195. doi: 10.1016/j.cellin.2024.100195. eCollection 2024 Dec. Cell Insight. 2024. PMID: 39391004 Free PMC article. Review.
References
- Allis C. D., Jenuwein T., The molecular hallmarks of epigenetic control. Nat. Rev. Genet. 17, 487–500 (2016). - PubMed
- Zhang B., Zheng H., Huang B., Li W., Xiang Y., Peng X., Ming J., Wu X., Zhang Y., Xu Q., Liu W., Kou X., Zhao Y., He W., Li C., Chen B., Li Y., Wang Q., Ma J., Yin Q., Kee K., Meng A., Gao S., Xu F., Na J., Xie W., Allelic reprogramming of the histone modification H3K4me3 in early mammalian development. Nature 537, 553–557 (2016). - PubMed
- Xia W., Xu J., Yu G., Yao G., Xu K., Ma X., Zhang N., Liu B., Li T., Lin Z., Chen X., Li L., Wang Q., Shi D., Shi S., Zhang Y., Song W., Jin H., Hu L., Bu Z., Wang Y., Na J., Xie W., Sun Y.-P., Resetting histone modifications during human parental-to-zygotic transition. Science 365, 353–360 (2019). - PubMed
Publication types
MeSH terms
Substances
LinkOut - more resources
Full Text Sources
Molecular Biology Databases
Research Materials
