RNA localization and co-translational interactions control RAB13 GTPase function and cell migration - PubMed (original) (raw)
RNA localization and co-translational interactions control RAB13 GTPase function and cell migration
Konstadinos Moissoglu et al. EMBO J. 2020.
Abstract
Numerous RNAs exhibit specific distribution patterns in mammalian cells. However, the functional and mechanistic consequences are relatively unknown. Here, we investigate the functional role of RNA localization at cellular protrusions of migrating mesenchymal cells, using as a model the RAB13 RNA, which encodes a GTPase important for vesicle-mediated membrane trafficking. While RAB13 RNA is enriched at peripheral protrusions, the expressed protein is concentrated perinuclearly. By specifically preventing RAB13 RNA localization, we show that peripheral RAB13 translation is not important for the overall distribution of the RAB13 protein or its ability to associate with membranes, but is required for full activation of the GTPase and for efficient cell migration. RAB13 translation leads to a co-translational association of nascent RAB13 with the exchange factor RABIF. Our results indicate that RAB13-RABIF association at the periphery is required for directing RAB13 GTPase activity to promote cell migration. Thus, translation of RAB13 in specific subcellular environments imparts the protein with distinct properties and highlights a means of controlling protein function through local RNA translation.
Keywords: RABIF; RAB13; RNA localization; antisense oligo; co-translational interaction.
© 2020 The Authors. Published under the terms of the CC BY 4.0 license.
Conflict of interest statement
The authors declare that they have no conflict of interest.
Figures
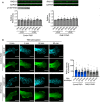
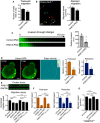
Figure 1. RAB13 RNA and protein exhibit distinct subcellular distributions
- Representative FISH images showing RAB13 RNA distribution in MDA‐MB-231 cells. Nuclei and cell outlines are shown in blue and green, respectively. Arrows point to RAB13 RNA concentrated at protrusive regions. Boxed regions are magnified in the insets.
- Representative immunofluorescence images of RAB13 protein in cells transfected with the indicated siRNAs. Reduction of intensity in RAB13 knockdown cells confirms the specificity of the signal. Arrows point to perinuclear RAB13 protein. Calibration bar shows intensity values.
- Ratios of peripheral/perinuclear intensity calculated from images as shown in (A) and (B). Bars: mean ± s.e.m. Values within each bar represent number of cells observed in 3 independent experiments.
- Protrusions (Ps) and cell bodies (CB) of cells induced to migrate toward LPA were isolated and analyzed to detect the indicated proteins (by Western blot; left panels) or RNAs (by RT‐ddPCR; right panel). Ps/CB enrichment ratios from 2 independent experiments are shown. Bars: mean ± s.e.m. The enrichment of pY397‐FAK serves to verify the enrichment of protrusions containing newly formed adhesions in the Ps fraction.
Data information: _P_‐values: **< 0.01; ****< 0.0001 by Student's _t_‐test (C) or analysis of variance with Dunnett's multiple comparisons test against GFP (D). Scale bars: 10 μm.
Figure EV1. RAB13 protein levels do not change upon serum stimulation
MDA‐MB‐231 cells were stimulated with serum for the indicated times, in the presence or absence of cycloheximide (CHX). The cells were also treated with control or RAB13‐mislocalizing PMOs.
- Representative Western blot analysis of whole‐cell lysates and corresponding quantitations of RAB13 levels from n = 4–5 replicates. Bars: mean ± s.e.m. No significant differences by Friedman's test. Increase in pY397‐FAK levels attests to serum stimulation.
- RAB13 immunofluorescence at representative protrusive regions. A cell line expressing GFP was used to delineate cell borders and provide an internal cytosolic control. RAB13 signal at front lamellipodial regions was quantified. n = 35–51 protrusions. Bars: mean ± s.e.m. No increase is detected upon stimulation. By contrast, at early time points a decrease is detected (5 and 20 min, P < 0.01 by Kruskal–Wallis test), potentially arising from serum‐induced endocytosis of RAB13‐containing membranes. Scale bars: 8 μm.
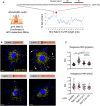
Figure 2. A GA‐rich motif in the mouse Rab13 3′UTR is necessary for localization at protrusions
- Schematic showing the %GA content along the mouse Rab13 3′UTR using a 30‐nt window size. Occurrences of the consensus GA‐rich motif are indicated by a red rectangle. The exact sequence between nucleotides 153–216 is shown with GA motifs in red and deleted regions indicated by black bars. _P_‐value by Fisher's exact test with Bonferroni's correction.
- FISH images of mouse fibroblasts expressing the β‐globin coding sequence followed by the indicated UTRs. β‐globin RNA is shown in yellow. Nuclei and cell outlines are shown in blue. Arrows point to β‐globin RNA concentrated at protrusive regions. Δ1 and Δ1 + 2 indicate deletions of the regions shown in (A). Scale bars: 10 μm.
- Distribution of β‐globin RNA or of Ddr2 RNA detected in the same cells, quantified by measuring a Peripheral Distribution Index (PDI). N = 35–55 cells observed in 3 independent experiments. Bars: mean ± 95% CI. ****P < 0.0001 by analysis of variance with Dunnett's multiple comparisons test.
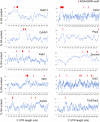
Figure EV2. GA‐rich motif distribution in 3′UTRs of APC‐dependent RNAs
Graphs show the % GA content along the 3′UTR of the indicated APC‐dependent RNAs using a 30‐nt window size. The graph showing the Rab13 UTR is the same presented in Figs 2A and 3A. Occurrences of the consensus GA‐rich motif are indicated by a red rectangle. Wider rectangles indicate the presence of multiple motifs. Exact sizes are not to scale due to the variable UTR lengths. The majority of GA‐rich motifs are found within more extended GA‐rich regions with GA content > 75%. Note that the GA motif is 7 nts, while the window for %GA calculation is 30 nts.
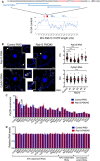
Figure 3. Antisense oligonucleotides against the GA‐rich region specifically interfere with localization of Rab13 RNA
- Schematic showing positions along the mouse Rab13 3′UTR targeted by the indicated PMOs. PMOs #1, 2, and 3 target the RGAAGRR motifs or the adjacent GA‐rich region. PMOs #6 and #7 target the Rab13 3′UTR outside of the GA‐rich region. The control PMO targets an intronic sequence of human β‐globin. Red rectangles and text indicate the location of the GA‐rich motifs.
- FISH images and corresponding PDI measurements of mouse fibroblast cells treated with the indicated PMOs. Cyb5r3 is an APC‐dependent RNA also enriched at protrusions. Arrows: peripheral Rab13 RNA. Arrowheads: perinuclear Rab13 RNA. Boxed regions are magnified in the insets. Note that Rab13 RNA becomes perinuclear in cells treated with PMOs against the GA‐rich region. Scale bars: 10 μm. (4 μm in insets). ****P < 0.0001 by analysis of variance with Dunnett's multiple comparisons test. N = 40–90 cells observed in 3–6 independent experiments. Bars: mean ± 95% CI.
- Protrusion (Ps) and cell body (CB) fractions were isolated from cells treated with control PMO or Rab13‐PMO #2. The indicated RNAs were detected through nanoString analysis to calculate Ps/CB enrichment ratios (n = 3; bars: mean ± s.e.m.). Note that only the distribution of Rab13 RNA is affected. **P = 0.01 by two‐way ANOVA with Bonferroni's multiple comparisons test against the corresponding control.
- Levels of the indicated RNAs were determined using nanoString analysis from control‐ or Rab13 PMO #2-treated cells (n = 4; bars: mean ± s.e.m.). No significant differences were detected by two‐way ANOVA against the corresponding controls.
Figure 4. The human RAB13 3′UTR contains a functionally conserved GA‐rich region required for peripheral localization
- Schematic showing %GA content and positions along the human RAB13 3′UTR targeted by the indicated PMOs. Red rectangles indicate the location of GA‐rich motifs. Graphs present PDI measurements of RAB13 RNA (upper panel) or NET1 RNA (another APC‐dependent RNA; bottom panel) detected in MDA‐MB-231 cells treated with the indicated PMOs. PDI = 1 indicates a diffuse distribution. _P_‐values: **< 0.01, ***< 0.001, ****< 0.0001 by analysis of variance with Dunnett's multiple comparisons test. n.s.: non‐significant. N = 30–73 cells observed in 3–5 independent experiments. Bars: mean ± s.e.m.
- Representative FISH images of cells treated with the indicated PMOs. Arrows point to peripheral RNA. Arrowheads point to perinuclear RNA. Boxed regions are magnified in the insets. Note that RAB13 RNA becomes perinuclear in cells treated with PMOs against the GA‐rich region, while NET1 remains localized at protrusions. Scale bars: 10 μm (4 μm in insets).
- RAB13 protein levels were measured by quantitative Western blot and normalized to total α‐tubulin or GAPDH levels (for representative blot, see Fig 5E). Relative levels in RAB13 PMO‐treated cells compared to control are shown. No significant differences were detected by Kruskal–Wallis test with Dunn's multiple comparisons test. N = 3–8. Bars: mean ± SD.
Figure 5. Loss of peripheral RAB13 RNA localization disrupts cell migration and phenocopies acute RAB13 protein loss
- Transwell migration of MDA-MB‐231 cells treated with control PMOs or RAB13 PMOs (191 + 230). Cells reaching the bottom surface after 4 h were counted. n = 25 fields of view in each of 6 independent experiments. Bars: mean ± s.e.m.
- Cells expressing Cherry‐NLS, and treated with the indicated PMOs, were tracked every 5 min for 10 h to derive average migration speed. n = 65 cells. Bars: mean ± s.e.m.
- PMO‐treated cells were induced to invade through a Matrigel plug. Cell staining intensity in arbitrary units (a.u.) was used to quantify relative invasion from n = 4 independent experiments. Bars: mean ± s.e.m.
- Lifeact‐GFP-expressing cells were treated with the indicated PMOs and imaged every minute over 1 h. Sequential image frames, from a control cell, highlight edge retraction (red arrowheads) or protrusion (yellow arrowheads). Corresponding edge velocity is shown, with negative values indicating retraction and positive values indicating extension. Average protrusion and retraction speeds were calculated from n = 11–13 cells. Bars: mean ± s.e.m. See also Movies EV2 and EV3.
- Cells treated with the indicated PMOs or siRNAs were analyzed by Western blot (upper panels) to detect RAB13 and GAPDH protein levels. Migration speed was assessed as in (B) from n = 55–78 cells (bottom graph). Bars: mean ± s.e.m.
- Protrusion and retraction speed of cells treated with the indicated PMOs or siRNAs were assessed as in (D). Graphs show average normalized values from n = 10–13 cells imaged for 1 h. Bars: mean ± s.e.m.
- Migration speed of RAB13 knockdown cells re‐expressing GFP‐RAB13 or GFP‐RAB13 with a frameshift (fs) mutation at the beginning of the RAB13 coding region. 28–52 cells were analyzed. Bars: mean ± s.e.m. Similar results were obtained in two additional independent experiments. Re‐expressing cells were identified through GFP fluorescence, and cells with similar, low GFP signal were tracked. All cells are expressing cherry‐NLS for accurate tracking.
Data information: _P_‐values: *< 0.05; **< 0.01, ***< 0.001, ****< 0.0001, by Student's _t_‐test (A–D), analysis of variance with Dunnett's multiple comparisons test (E, F) or Kruskal–Wallis test with Dunn's multiple comparisons test (G). n.s.: not significant.Source data are available online for this figure.
Figure EV3. Peripheral localization of exogenous RAB13 RNA does not affect RAB13 RNA stability or translation
- Schematics depict GFP or GFP‐RAB13 constructs stably expressed in MDA‐MB-231 cells. RAB13 coding sequence is followed either by the wild‐type RAB13 UTR or by the RAB13 UTR carrying a 52‐nt deletion corresponding to the region targeted by PMOs 191 and 230 (ΔPMO UTR). Exogenous RNA is detected by FISH against the GFP sequence. Arrows point to RNA localized at protrusions. Scale bars: 10 μm. Graphs show PDI measurements of GFP or NET1 RNA from multiple cells. n = 42–54 cells in 4 independent experiments (for GFP); n = 27 cells in 2 experiments (for Net1). Bars: mean ± s.e.m. ****P < 0.0001 by analysis of variance with Dunnett's multiple comparisons test.
- Levels of GFP RNA from the indicated cell lines were assessed by RT‐ddPCR and normalized to housekeeping control RNAs. n = 6. Bars: mean ± s.e.m. n.s.: not significant by one‐way ANOVA.
- The indicated cell lines were analyzed by flow cytometry to assess GFP intensity per cell.
- GFP‐RAB13 protein levels of the indicated cell lines were assessed by quantitative Western blot and normalized to α‐tubulin levels. n = 7. Bars: mean ± s.e.m. n.s.: not significant by Wilcoxon matched‐pairs signed‐rank test.
Figure 6. Peripheral RAB13 RNA translation is required for RAB13 protein activation but not steady‐state distribution or membrane association
- A
Wide‐field images of RAB13 immunofluorescence in MDA‐MB-231 cells treated with control or RAB13 (191 + 230) PMOs and ratios of peripheral/perinuclear intensity. Scale bars: 10 μm. n = 45–50 cells. Bars: mean ± s.e.m. Similar results were observed in two additional independent experiments. - B
Fluorescence images (projections of confocal slices throughout the cell height) of cells expressing GFP‐RAB13 with the indicated UTRs. Note that in both cases the protein assumes indistinguishable distribution. Scale bars: 10 μm. - C
Soluble/particulate fractionation of the indicated cell lines followed by Western blot to detect the indicated proteins. RhoGDI and TfRc serve as soluble and particulate markers, respectively. Graph shows quantitation from n = 3 independent experiments. Bars: mean ± s.e.m. - D, E
Active RAB13 (RAB13‐GTP) was pulled down using MICAL‐L1 RBD‐GST from the indicated PMO‐treated cells (D) or GFP‐RAB13‐expressing lines (E). The amount of endogenous or exogenous RAB13 was measured by quantitative Western blot, and relative levels of active RAB13 are plotted. n = 8 (D), n = 4 (E). Bars: mean ± s.e.m.
Data information: _P‐_values: *< 0.05, **< 0.01 by Kruskal–Wallis test.Source data are available online for this figure.
Figure EV4. RAB13 RNA mislocalization does not affect RAB13 binding to membranes or association with REP‐1 or RabGDI
- Cells treated with the indicated PMOs were fractionated into soluble and particulate fractions, and the indicated proteins were detected by Western blot. RhoGDI and TfRc serve as soluble and particulate markers, respectively.
- Lysates from the indicated GFP or GFP‐RAB13‐expressing cell lines were immunoprecipitated with anti‐GFP antibodies and blotted to detect the indicated proteins. Relative REP‐1 and RabGDI binding are quantified in the graphs from n = 3 (REP‐1) and n = 5 (RabGDI) independent experiments. Bars: mean ± s.e.m. No significant differences were detected by Wilcoxon matched‐pairs signed‐rank test.
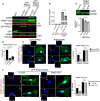
Figure 7. Peripheral RAB13 RNA promotes the local association of RAB13 with the exchange factor RABIF
- Immunoprecipitation and Western blot analysis to detect proteins bound to GFP‐RAB13 expressed from constructs carrying wt or ΔPMO RAB13 3′UTR. GFP‐RAB13 (T22N) expresses a nucleotide‐free mutant which binds tightly to putative GEFs. RABIF panel is also shown with adjusted contrast to reveal lower binding to wtGFP‐RAB13.
- Quantification of RABIF binding to RAB13 from experiments as in (A). n = 6. Bars: mean ± s.e.m.
- Active RAB13 pull‐down assay from cells with CRISPR knockdown of RABIF using the indicated sgRNAs. n = 3. Bars: mean ± s.e.m.
- Quantification of RABIF‐RAB13 PLA signal from cells transfected with the indicated siRNAs. Number of observed cells is indicated within each bar. Bars: mean ± s.e.m. Similar results were observed in one additional independent experiment.
- Representative RABIF‐RAB13 PLA images and quantitations from cells transfected with the indicated PMOs. N > 70 cells. Bars: mean ± s.e.m. Arrows indicate PLA signal at the cell periphery. Arrowheads indicate PLA signal within the cell body. Boxed regions are magnified in the insets. Scale bars: 15 μm; 5 μm in insets.
- Representative RABIF‐GFP PLA images and quantitations from cells expressing GFP‐RAB13(T22N) carrying wt or ΔPMO RAB13 3′UTR. N > 70 cells. Bars: mean ± s.e.m. Arrows indicate PLA signal at the cell periphery. Arrowheads indicate PLA signal within the cell body. Boxed regions are magnified in the insets. Scale bars: 10 μm; 4 μm in insets.
Data information: _P_‐values: *< 0.05, **< 0.01, ***< 0.001, ****< 0.0001 by Wilcoxon matched‐pairs signed‐rank test (B) or analysis of variance with Dunn's, Dunnett's, or Tukey's multiple comparisons test (C–F).Source data are available online for this figure.
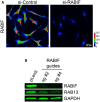
Figure EV5. RABIF distribution and effect on RAB13 expression
- Representative immunofluorescence images of RABIF protein in cells transfected with the indicated siRNAs. Reduction of intensity in knockdown cells confirms the specificity of the signal. Calibration bar shows intensity values. Note that RABIF exhibits a mostly perinuclear enrichment.
- RAB13 expression in cells with CRISPR knockdown of RABIF using the indicated sgRNAs (see also Fig 7C).
Figure 8. RABIF associates with RAB13 co‐translationally
- Schematic depicting experimental strategy for assessing co‐translational association of RABIF with nascent RAB13.
- Quantification of GFP RNA levels associating with RABIF in immunoprecipitation assays from the indicated cell lines. Note that even though RABIF binds several‐fold more to RAB13(T22N) (see Fig 7A and B), it binds similarly to the wild‐type and T22N RAB13 RNA, indicating that RABIF binds similarly to nascent RAB13. After translation, it is likely displaced upon GTP loading of wild‐type RAB13, while it remains more stably bound to the nucleotide‐free (T22N) form. N = 6. Bars: mean ± s.e.m. _P_‐values: *< 0.05 by analysis of variance with Dunn's multiple comparisons test.
- Proposed model for regulation of RAB13 activity through local RNA translation. See text for details.
Similar articles
- Rab13 acts downstream of the kinase Mst1 to deliver the integrin LFA-1 to the cell surface for lymphocyte trafficking.
Nishikimi A, Ishihara S, Ozawa M, Etoh K, Fukuda M, Kinashi T, Katagiri K. Nishikimi A, et al. Sci Signal. 2014 Jul 29;7(336):ra72. doi: 10.1126/scisignal.2005199. Sci Signal. 2014. PMID: 25074980 - Rab8A and Rab13 are activated by insulin and regulate GLUT4 translocation in muscle cells.
Sun Y, Bilan PJ, Liu Z, Klip A. Sun Y, et al. Proc Natl Acad Sci U S A. 2010 Nov 16;107(46):19909-14. doi: 10.1073/pnas.1009523107. Epub 2010 Nov 1. Proc Natl Acad Sci U S A. 2010. PMID: 21041651 Free PMC article. - DENND2B activates Rab13 at the leading edge of migrating cells and promotes metastatic behavior.
Ioannou MS, Bell ES, Girard M, Chaineau M, Hamlin JN, Daubaras M, Monast A, Park M, Hodgson L, McPherson PS. Ioannou MS, et al. J Cell Biol. 2015 Mar 2;208(5):629-48. doi: 10.1083/jcb.201407068. Epub 2015 Feb 23. J Cell Biol. 2015. PMID: 25713415 Free PMC article. - Regulation of Cancer Cell Behavior by the Small GTPase Rab13.
Ioannou MS, McPherson PS. Ioannou MS, et al. J Biol Chem. 2016 May 6;291(19):9929-37. doi: 10.1074/jbc.R116.715193. Epub 2016 Apr 4. J Biol Chem. 2016. PMID: 27044746 Free PMC article. Review. - Rab GTPase localization and Rab cascades in Golgi transport.
Pfeffer SR. Pfeffer SR. Biochem Soc Trans. 2012 Dec 1;40(6):1373-7. doi: 10.1042/BST20120168. Biochem Soc Trans. 2012. PMID: 23176483 Free PMC article. Review.
Cited by
- Regulation and outcomes of localized RNA translation.
Gasparski AN, Mason DE, Moissoglu K, Mili S. Gasparski AN, et al. Wiley Interdiscip Rev RNA. 2022 Nov;13(6):e1721. doi: 10.1002/wrna.1721. Epub 2022 Feb 14. Wiley Interdiscip Rev RNA. 2022. PMID: 35166036 Free PMC article. Review. - Stratum is required for both apical and basolateral transport through stable expression of Rab10 and Rab35 in Drosophila photoreceptors.
Ochi Y, Yamashita H, Yamada Y, Satoh T, Satoh AK. Ochi Y, et al. Mol Biol Cell. 2022 Sep 1;33(10):br17. doi: 10.1091/mbc.E21-12-0596. Epub 2022 Jun 29. Mol Biol Cell. 2022. PMID: 35767331 Free PMC article. - mRNA location and translation rate determine protein targeting to dual destinations.
Gasparski AN, Moissoglu K, Pallikkuth S, Meydan S, Guydosh NR, Mili S. Gasparski AN, et al. Mol Cell. 2023 Aug 3;83(15):2726-2738.e9. doi: 10.1016/j.molcel.2023.06.036. Epub 2023 Jul 27. Mol Cell. 2023. PMID: 37506697 Free PMC article. - G3BP1 ribonucleoprotein complexes regulate focal adhesion protein mobility and cell migration.
Boraas LC, Hu M, Martino P, Thornton L, Vejnar CE, Zhen G, Zeng L, Parker DM, Cox AL, Giraldez AJ, Su X, Mayr C, Wang S, Nicoli S. Boraas LC, et al. Cell Rep. 2025 Feb 25;44(2):115237. doi: 10.1016/j.celrep.2025.115237. Epub 2025 Feb 1. Cell Rep. 2025. PMID: 39883578 Free PMC article. - Localization of Kif1c mRNA to cell protrusions dictates binding partner specificity of the encoded protein.
Norris ML, Mendell JT. Norris ML, et al. Genes Dev. 2023 Mar 1;37(5-6):191-203. doi: 10.1101/gad.350320.122. Epub 2023 Mar 1. Genes Dev. 2023. PMID: 36859340 Free PMC article.
References
- Besse F, Ephrussi A (2008) Translational control of localized mRNAs: restricting protein synthesis in space and time. Nat Rev Mol Cell Biol 9: 971–980 - PubMed
Publication types
MeSH terms
Substances
LinkOut - more resources
Full Text Sources
Other Literature Sources
Molecular Biology Databases
Research Materials

