N,N-dimethyltryptamine compound found in the hallucinogenic tea ayahuasca, regulates adult neurogenesis in vitro and in vivo - PubMed (original) (raw)
N,N-dimethyltryptamine compound found in the hallucinogenic tea ayahuasca, regulates adult neurogenesis in vitro and in vivo
Jose A Morales-Garcia et al. Transl Psychiatry. 2020.
Abstract
N,N-dimethyltryptamine (DMT) is a component of the ayahuasca brew traditionally used for ritual and therapeutic purposes across several South American countries. Here, we have examined, in vitro and vivo, the potential neurogenic effect of DMT. Our results demonstrate that DMT administration activates the main adult neurogenic niche, the subgranular zone of the dentate gyrus of the hippocampus, promoting newly generated neurons in the granular zone. Moreover, these mice performed better, compared to control non-treated animals, in memory tests, which suggest a functional relevance for the DMT-induced new production of neurons in the hippocampus. Interestingly, the neurogenic effect of DMT appears to involve signaling via sigma-1 receptor (S1R) activation since S1R antagonist blocked the neurogenic effect. Taken together, our results demonstrate that DMT treatment activates the subgranular neurogenic niche regulating the proliferation of neural stem cells, the migration of neuroblasts, and promoting the generation of new neurons in the hippocampus, therefore enhancing adult neurogenesis and improving spatial learning and memory tasks.
Conflict of interest statement
The authors declare that they have no conflict of interest.
Figures
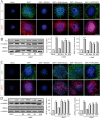
Fig. 1. N,N-dimethyltryptamine (DMT) activates the hippocampal subgranular neurogenic niche through sigma-1 receptor (S1R).
SGZ-derived neurospheres (NS) were treated during 7 days with DMT alone or in combination with the antagonists BD1063 (BD), methiothepin (Met), ritanserin (Rit), and WAY100635 (WAY). a Expression of the S1R (green) on neural stem cells (NSCs) (red-labeled with nestin) determined by immunocytochemistry (n = 8 neurospheres) and western blot analysis (n = 12 blots). b Representative western blots and quantification showing expression levels of the stemness markers musashi-1, nestin, and SOX-2 in NSCs. c Representative phase-contrast micrographs showing NS formation and quantification of the number and diameter of NS (n = 50 neurospheres per condition). Scale bar = 100 μm. d Confocal fluorescent images showing the expression of the cellular marker for proliferation ki67 (green) in NS after treatments (n = 8 per condition). DAPI was used for nuclear staining. Scale bar = 50 μm. e Representative western blots and quantification showing the proliferating cell nuclear antigen (PCNA) levels in NS. Values in bar graphs indicate mean ± SD of the quantification of four different cellular pools with three independent experiments/pool (n = 12 blots). After confirming the significance of the primary findings using ANOVA, a significance level of P < 0.05 was applied to all remaining post hoc (Tukey test) statistical analyses. **P ≤ 0.01 indicates significant results versus non-treated (basal) cultures.
Fig. 2. N,N-dimethyltryptamine (DMT) promotes stem cell differentiation toward all neural phenotypes.
SGZ-derived neurospheres were cultured for 7 days in the presence of DMT alone or in combination with the antagonists BD1063 (BD), methiothepin (Met), ritanserin (Rit), and WAY100635 (WAY) and then were adhered on a substrate and allowed to differentiate for 3 days. a Confocal fluorescent images showing the expression of the neuronal markers β-III-Tubulin (TuJ-1 clone, green) and MAP-2 (red) in NS (n = 8 per condition). DAPI was used for nuclear staining. Scale bar = 50 μm. b Representative western blots and quantification of β-tubulin and MAP-2. c Immunofluorescence images showing NS expressing the glial fibrillary acidic protein (GFAP, red) that stains astrocytes, and in green, the oligodendrocyte marker CNPase (n = 8 per condition). DAPI was used for nuclear staining. Scale bar = 50 μm. d Representative western blots of CNPase and GFAP and quantification. Results are the mean ± SD of four different cellular pools with three independent experiments/pool (n = 12). After confirming the significance of the primary findings using ANOVA, a significance level of P < 0.05 was applied to all remaining post hoc (Tukey test) statistical analyses. **P ≤ 0.01; ***P ≤ 0.001 indicate significant results versus non-treated (basal) cultures.
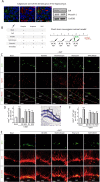
Fig. 3. N,N-dimethyltryptamine (DMT) promotes in vivo activation of the neurogenic niche located in the SGZ of the dentate gyrus in the hippocampus.
a Representative images (n = 3 animals) showing the expression of the sigma-1 receptor (S1R, green) on neural stem cells (NSCs) (red-labeled with nestin) in the subgranular zone of the dentate gyrus. S1R expression was also determined by western blot on hippocampal tissue (n = 3 animals). b Schematic representation of experimental design and treatment schedule for in vivo short-term neurogenic study. DMT alone or in combination with the antagonists BD1063 (BD), methiothepin (Met), ritanserin (Rit), or WAY100635 (WAY) was daily intraperitoneally injected during 4 days. To label proliferating cells, on day 4 mice were i.p. injected with 5-bromo-2-deoxyuridine (BrdU) and sacrificed on day 5. c Confocal maximum intensity projection images showing BrdU/Nestin co-staining on the SGZ of adult mice. BrdU is shown in green and nestin in red. Scale bar = 25 μm. d Quantification of the number of double BrdU/Nestin cells in the DG performed on confocal orthogonal images is shown. e Double BrdU+-DCX+ expressing cells in the SGZ. Confocal maximum intensity projection images show BrdU in green and DCX in red. Scale bar = 25 μm. f Quantification of the number of BrdU+- DCX+ cells in the DG is shown. All quantification values represent the mean ± SD (n = 5 animals per group). After confirming the significance of the primary findings using ANOVA, a significance level of P < 0.05 was applied to all remaining post hoc (Tukey test) statistical analyses. **P ≤ 0.01; ***P ≤ 0.001 indicate significant results versus vehicle-treated (basal) animals.
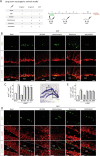
Fig. 4. N,N-dimethyltryptamine (DMT) promotes in vivo neurogenesis on the subgranular zone of the dentate gyrus in the hippocampus.
a Schematic representation of the experimental design and treatment schedule for in vivo long-term neurogenic study. DMT alone or in combination with the antagonists BD1063 (BD), methiothepin (Met), ritanserin (Rit), or WAY100635 (WAY) was intraperitoneal injected on alternate days during 21 days. To label proliferating cells, on day 1 mice were i.p. injected with 5-bromo-2-deoxyuridine (BrdU) and sacrificed on day 21. b BrdU-DCX-expressing cells in the DG. Representative confocal images are shown. Scale bar = 25 μm. c Quantification of the number of BrdU+-DCX+-expressing cells in the DG based on confocal orthogonal images. d Confocal maximum intensity projection images showing the colocalization of BrdU (green) and neuN (red) cells in the dentate gyrus of the hippocampus of adult mice. Scale bar = 25 μm. e Quantification of the number of BrdU+/NeuN+ cells performed on confocal orthogonal images in DG. Values represent the mean ± SD (n = 5 animals per group). After confirming the significance of the primary findings using ANOVA, a significance level of P < 0.05 was applied to all remaining post hoc (Tukey test) statistical analyses. **P ≤ 0.01; ***P ≤ 0.001 indicate significant results versus vehicle-treated (basal) animals.
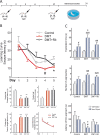
Fig. 5. N,N-dimethyltryptamine (DMT) promotes improved performance in learning tasks linked to hippocampal neurogenesis.
a Schematic representation of the experimental design for behavioral tests. DMT alone or in combination with the antagonist ritanserin (Rit) was intraperitoneally injected on alternating days for 21 days. Then, behavioral tests were performed for 10 days, and finally animals were sacrificed on day 31. b Data from Morris water maze test. *P < 0.05; **P < 0.01; ***P < 0.001 versus the control group. #P < 0.05 versus DMT + ritanserin group. c Data from the novel object recognition test. Values represent the mean ± SEM (n = 12 per group). *P < 0.05 versus the control group. #P < 0.05; ##P < 0.01; ###P < 0.001 versus old object. After confirming the significance of the primary findings using ANOVA, a significance level of P < 0.05 was applied to all remaining post hoc (Tukey test) statistical analyses.
Similar articles
- Metabolism and disposition of N,N-dimethyltryptamine and harmala alkaloids after oral administration of ayahuasca.
Riba J, McIlhenny EH, Valle M, Bouso JC, Barker SA. Riba J, et al. Drug Test Anal. 2012 Jul-Aug;4(7-8):610-6. doi: 10.1002/dta.1344. Epub 2012 Apr 19. Drug Test Anal. 2012. PMID: 22514127 - Dimethyltryptamine: Endogenous Role and Therapeutic Potential.
Rodrigues AV, Almeida FJ, Vieira-Coelho MA. Rodrigues AV, et al. J Psychoactive Drugs. 2019 Sep-Oct;51(4):299-310. doi: 10.1080/02791072.2019.1602291. Epub 2019 Apr 25. J Psychoactive Drugs. 2019. PMID: 31018803 Review. - Psychedelic Therapy: A Primer for Primary Care Clinicians-N,N-Dimethyltryptamine and Ayahuasca.
Shinozuka K, Tabaac BJ, Arenas A, Beutler BD, Cherian K, Evans VD, Fasano C, Muir OS. Shinozuka K, et al. Am J Ther. 2024 Mar-Apr 01;31(2):e112-e120. doi: 10.1097/MJT.0000000000001725. Am J Ther. 2024. PMID: 38518268 - The alkaloids of Banisteriopsis caapi, the plant source of the Amazonian hallucinogen Ayahuasca, stimulate adult neurogenesis in vitro.
Morales-García JA, de la Fuente Revenga M, Alonso-Gil S, Rodríguez-Franco MI, Feilding A, Perez-Castillo A, Riba J. Morales-García JA, et al. Sci Rep. 2017 Jul 13;7(1):5309. doi: 10.1038/s41598-017-05407-9. Sci Rep. 2017. PMID: 28706205 Free PMC article. - Administration of N,N-dimethyltryptamine (DMT) in psychedelic therapeutics and research and the study of endogenous DMT.
Barker SA. Barker SA. Psychopharmacology (Berl). 2022 Jun;239(6):1749-1763. doi: 10.1007/s00213-022-06065-0. Epub 2022 Jan 22. Psychopharmacology (Berl). 2022. PMID: 35064294 Free PMC article. Review.
Cited by
- Protocol for Outcome Evaluation of Ayahuasca-Assisted Addiction Treatment: The Case of Takiwasi Center.
Rush B, Marcus O, García S, Loizaga-Velder A, Loewinger G, Spitalier A, Mendive F. Rush B, et al. Front Pharmacol. 2021 May 19;12:659644. doi: 10.3389/fphar.2021.659644. eCollection 2021. Front Pharmacol. 2021. PMID: 34093190 Free PMC article. - The mechanistic divide in psychedelic neuroscience: An unbridgeable gap?
Barksdale BR, Doss MK, Fonzo GA, Nemeroff CB. Barksdale BR, et al. Neurotherapeutics. 2024 Mar;21(2):e00322. doi: 10.1016/j.neurot.2024.e00322. Epub 2024 Jan 25. Neurotherapeutics. 2024. PMID: 38278658 Free PMC article. Review. - Human pluripotent stem cells as a translational toolkit in psychedelic research in vitro.
Salerno JA, Rehen S. Salerno JA, et al. iScience. 2024 Mar 28;27(5):109631. doi: 10.1016/j.isci.2024.109631. eCollection 2024 May 17. iScience. 2024. PMID: 38628967 Free PMC article. Review. - N,N-dimethyltryptamine and Amazonian ayahuasca plant medicine.
James E, Keppler J, L Robertshaw T, Sessa B. James E, et al. Hum Psychopharmacol. 2022 May;37(3):e2835. doi: 10.1002/hup.2835. Epub 2022 Feb 17. Hum Psychopharmacol. 2022. PMID: 35175662 Free PMC article. Review. - The Effects of Psychedelics on Neuronal Physiology.
Hatzipantelis CJ, Olson DE. Hatzipantelis CJ, et al. Annu Rev Physiol. 2024 Feb 12;86:27-47. doi: 10.1146/annurev-physiol-042022-020923. Epub 2023 Nov 6. Annu Rev Physiol. 2024. PMID: 37931171 Free PMC article. Review.
References
Publication types
MeSH terms
Substances
LinkOut - more resources
Full Text Sources
Other Literature Sources


