Antibody dynamics to SARS-CoV-2 in asymptomatic COVID-19 infections - PubMed (original) (raw)
. 2021 Feb;76(2):551-561.
doi: 10.1111/all.14622. Epub 2020 Oct 26.
Yang Li 2, Hong-Yan Hou 3, Feng Wang 3, Zhu-Qing Ouyang 1, Yandi Zhang 1, Dan-Yun Lai 2, Jo-Lewis Banga Ndzouboukou 1, Zhao-Wei Xu 2, Bo Zhang 3, Hong Chen 2, Jun-Biao Xue 2, Xiao-Song Lin 1, Yun-Xiao Zheng 2, Zong-Jie Yao 1, Xue-Ning Wang 2, Cai-Zheng Yu 4, He-Wei Jiang 2, Hai-Nan Zhang 2, Huan Qi 2, Shu-Juan Guo 2, Sheng-Hai Huang 5, Zi-Yong Sun 3, Sheng-Ce Tao 2, Xiong-Lin Fan 1
Affiliations
- PMID: 33040337
- PMCID: PMC7675426
- DOI: 10.1111/all.14622
Antibody dynamics to SARS-CoV-2 in asymptomatic COVID-19 infections
Qing Lei et al. Allergy. 2021 Feb.
Abstract
Background: The missing asymptomatic COVID-19 infections have been overlooked because of the imperfect sensitivity of the nucleic acid testing (NAT). Globally understanding the humoral immunity in asymptomatic carriers will provide scientific knowledge for developing serological tests, improving early identification, and implementing more rational control strategies against the pandemic.
Measure: Utilizing both NAT and commercial kits for serum IgM and IgG antibodies, we extensively screened 11 766 epidemiologically suspected individuals on enrollment and 63 asymptomatic individuals were detected and recruited. Sixty-three healthy individuals and 51 mild patients without any preexisting conditions were set as controls. Serum IgM and IgG profiles were further probed using a SARS-CoV-2 proteome microarray, and neutralizing antibody was detected by a pseudotyped virus neutralization assay system. The dynamics of antibodies were analyzed with exposure time or symptoms onset.
Results: A combination test of NAT and serological testing for IgM antibody discovered 55.5% of the total of 63 asymptomatic infections, which significantly raises the detection sensitivity when compared with the NAT alone (19%). Serum proteome microarray analysis demonstrated that asymptomatics mainly produced IgM and IgG antibodies against S1 and N proteins out of 20 proteins of SARS-CoV-2. Different from strong and persistent N-specific antibodies, S1-specific IgM responses, which evolved in asymptomatic individuals as early as the seventh day after exposure, peaked on days from 17 days to 25 days, and then disappeared in two months, might be used as an early diagnostic biomarker. 11.8% (6/51) mild patients and 38.1% (24/63) asymptomatic individuals did not produce neutralizing antibody. In particular, neutralizing antibody in asymptomatics gradually vanished in two months.
Conclusion: Our findings might have important implications for the definition of asymptomatic COVID-19 infections, diagnosis, serological survey, public health, and immunization strategies.
Keywords: COVID-19; SARS-CoV-2; antibody dynamics; asymptomatic; neutralizing antibody.
© European Academy of Allergy and Clinical Immunology and John Wiley & Sons Ltd.
Conflict of interest statement
The authors declare no conflicts of interest. Dr Lei has nothing to disclose. Dr Li has nothing to disclose. Dr Hou has nothing to disclose. Dr Wang has nothing to disclose. Dr Ouyang has nothing to disclose. Dr Zhang has nothing to disclose. Dr Lai has nothing to disclose. Dr Banga Ndzouboukou has nothing to disclose. Dr Xu has nothing to disclose. Dr Zhang has nothing to disclose. Dr Chen has nothing to disclose. Dr Xue has nothing to disclose. Dr Lin has nothing to disclose. Dr Zheng has nothing to disclose. Dr Yao has nothing to disclose. Dr Wang has nothing to disclose. Dr Yu has nothing to disclose. Dr Jiang has nothing to disclose. Dr Zhang has nothing to disclose. Dr Qi has nothing to disclose. Dr Guo has nothing to disclose. Dr Huang has nothing to disclose. Dr Sun has nothing to disclose. Dr Tao has nothing to disclose. Dr Fan has nothing to disclose.
Figures
FIGURE 1
The workflow of screening participants
FIGURE 2
Antibody responses to different proteins of SARS‐CoV‐2. Serum proteome microarray was used to probe IgM or IgG antibody against 20 proteins of SARS‐CoV‐2 in all samples collected from 63 healthy controls, 63 asymptomatic individuals, and 51 mild patients. The results were expressed as mean {log2 (Fluorescence intensity)} ± SD in different groups. A, Comparison of IgM responses to five proteins among three groups. B, Comparison of IgG responses to five proteins among three groups. Both analysis of variance (ANOVA) and post hoc test (SNK) were conducted to test difference in means among healthy controls, asymptomatics, and mild patients. ***P < .001, **P < .01, *P < .05, and ns indicating no significance
FIGURE 3
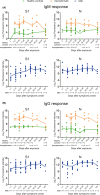
Dynamic changes of S1‐ and N‐specific IgM and IgG responses. Serum proteome microarray was used to probe antibody responses in the samples collected from 48 healthy individuals, 36 asymptomatic individuals, and 51 mild patients. The result of each serum sample was expressed as log2 (fluorescence intensity). 48 healthy controls and 36 asymptomatic infections having clear exposure history were plotted in sections according to the exposure time. 51 mild COVID‐19 patients with serial sera samples (n = 87) were segmented according to days after symptoms onset. The yellow, green and blue line showed the mean level of antibody responses in healthy controls, asymptomatic infections and mild patients, respectively. A, Dynamic changes of S1‐ and N‐specific IgM responses. B, Dynamic changes of S1‐ and N‐specific IgG responses
FIGURE 4
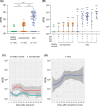
Neutralizing antibody responses and dynamics. The titer of neutralization antibody for each serum sample was expressed as the half‐maximal neutralizing titer (NT50), which was calculated by using nonlinear regression of SPSS. The results were shown as the medians of NT50 and interquartile ranges (IQRs) in different groups. A, Comparison of NT50 among healthy controls, asymptomatic infections and mild patients. B, Comparison of NT50 among different subgroups with that of healthy controls. C, Dynamic changes of NT50 for 48 healthy controls and 36 asymptomatic individuals over exposure time. D, Dynamic changes of NT50 for 51 mild COVID‐19 patients with the day after symptom onset. A loess 489 regression model was used to established the kinetics of neutralizing antibody by R. The lines show the mean value expected from a Loess 489 regression model, and the ribbons indicate the 95% confidence interval. Serum samples with NT50 below 1:10 are plotted at NT50 = 2
Similar articles
- Kinetics of SARS-CoV-2 Specific and Neutralizing Antibodies over Seven Months after Symptom Onset in COVID-19 Patients.
Zhu L, Xu X, Zhu B, Guo X, Xu K, Song C, Fu J, Yu H, Kong X, Peng J, Huang H, Zou X, Ding Y, Bao C, Zhu F, Hu Z, Wu M, Shen H. Zhu L, et al. Microbiol Spectr. 2021 Oct 31;9(2):e0059021. doi: 10.1128/Spectrum.00590-21. Epub 2021 Sep 22. Microbiol Spectr. 2021. PMID: 34550000 Free PMC article. - Long-Term Kinetics of SARS-CoV-2 Antibodies and Impact of Inactivated Vaccine on SARS-CoV-2 Antibodies Based on a COVID-19 Patients Cohort.
Zhang S, Xu K, Li C, Zhou L, Kong X, Peng J, Zhu F, Bao C, Jin H, Gao Q, Zhao X, Zhu L. Zhang S, et al. Front Immunol. 2022 Jan 27;13:829665. doi: 10.3389/fimmu.2022.829665. eCollection 2022. Front Immunol. 2022. PMID: 35154152 Free PMC article. - Longitudinal analysis of antibody dynamics in COVID-19 convalescents reveals neutralizing responses up to 16 months after infection.
Yang Y, Yang M, Peng Y, Liang Y, Wei J, Xing L, Guo L, Li X, Li J, Wang J, Li M, Xu Z, Zhang M, Wang F, Shi Y, Yuan J, Liu Y. Yang Y, et al. Nat Microbiol. 2022 Mar;7(3):423-433. doi: 10.1038/s41564-021-01051-2. Epub 2022 Feb 7. Nat Microbiol. 2022. PMID: 35132197 - Immune response following infection with SARS-CoV-2 and other coronaviruses: A rapid review.
O Murchu E, Byrne P, Walsh KA, Carty PG, Connolly M, De Gascun C, Jordan K, Keoghan M, O'Brien KK, O'Neill M, Smith SM, Teljeur C, Ryan M, Harrington P. O Murchu E, et al. Rev Med Virol. 2021 Mar;31(2):e2162. doi: 10.1002/rmv.2162. Epub 2020 Sep 23. Rev Med Virol. 2021. PMID: 32964627 Free PMC article. Review. - Silent battles: immune responses in asymptomatic SARS-CoV-2 infection.
Le Bert N, Samandari T. Le Bert N, et al. Cell Mol Immunol. 2024 Feb;21(2):159-170. doi: 10.1038/s41423-024-01127-z. Epub 2024 Jan 15. Cell Mol Immunol. 2024. PMID: 38221577 Review.
Cited by
- Symptomatic and Asymptomatic SARS-CoV-2 Infection and Follow-up of Neutralizing Antibody Levels.
Cui SJ, Zhang Y, Gao WJ, Wang XL, Yang P, Wang QY, Pang XH, Zeng XP, Li LM. Cui SJ, et al. Biomed Environ Sci. 2022 Dec 20;35(12):1100-1105. doi: 10.3967/bes2022.139. Biomed Environ Sci. 2022. PMID: 36597289 Free PMC article. - Response to the Letter to the Editor Regarding "Serologic Survey of IgG Against SARS-CoV-2 Among Hospital Visitors Without a History of SARS-CoV-2 Infection in Tokyo, 2020-2021".
Sanada T, Kohara M. Sanada T, et al. J Epidemiol. 2023 Feb 5;33(2):109. doi: 10.2188/jea.JE20220202. Epub 2022 Nov 11. J Epidemiol. 2023. PMID: 35908936 Free PMC article. No abstract available. - Kinetics of Neutralizing Antibody Response Underscores Clinical COVID-19 Progression.
Lei Q, Hou H, Yu C, Zhang Y, Ndzouboukou JB, Lin X, Yao Z, Fu H, Sun Z, Wang F, Fan X. Lei Q, et al. J Immunol Res. 2021 Oct 19;2021:9822706. doi: 10.1155/2021/9822706. eCollection 2021. J Immunol Res. 2021. PMID: 34712742 Free PMC article. - Titers, Prevalence, and Duration of SARS-CoV-2 Antibodies in a Local COVID-19 Outbreak and Following Vaccination.
Hedges JF, Thompson MA, Snyder DT, Robison A, Taylor MP, Jutila MA. Hedges JF, et al. Vaccines (Basel). 2021 Jun 2;9(6):587. doi: 10.3390/vaccines9060587. Vaccines (Basel). 2021. PMID: 34199357 Free PMC article. - Novel skewed usage of B-cell receptors in COVID-19 patients with various clinical presentations.
Ma J, Bai H, Gong T, Mao W, Nie Y, Zhang X, Da Y, Wang X, Qin H, Zeng Q, Hu F, Qi X, Shi B, Zhang C. Ma J, et al. Immunol Lett. 2022 Sep;249:23-32. doi: 10.1016/j.imlet.2022.08.006. Epub 2022 Aug 31. Immunol Lett. 2022. PMID: 36055412 Free PMC article.
References
- China Daily . WHO declares COVID‐19 a pandemic. Available at: http://www.nytimes.com/2020/03/11/world/coronavirus‐news.htm#link‐682e5b06. Accessed 21 June, 2020.
- WHO . Coronavirus disease (COVID‐2019) situation reports. Available at: https://www.who.int/emergencies/diseases/novel‐coronavirus‐2019/situatio.... Accessed 20 June, 2020.
- National Health Commission of the People's Republic of China . COVID‐19 Prevention and Control Plan, 3th edition. Available at: http://www.gov.cn/zhengce/zhengceku/2020‐01/29/content_5472893.htm. Accessed June 22, 2020. - PMC - PubMed
- Wu Z, McGoogan J. Characteristics of and Important Lessons From the Coronavirus Disease 2019 (COVID‐19) Outbreak in China: Summary of a Report of 72 314 Cases From the Chinese Center for Disease Control and Prevention. JAMA 2020;323:1239 ‐ 1242. - PubMed
Publication types
MeSH terms
Substances
Grants and funding
- 2016YFA0500600/National Key Research and Development Program of China Grant
- YG2020YQ10/Interdisciplinary Program of Shanghai Jiao Tong University
- 2020kfyXGYJ040/HUST COVID-19 Rapid Response Call
- 2018ZX10302302002-001/National Mega-Projects of Science Research for the 13th Five-year Plan of China
- 2016YFA0500600/Research and Development
- YG2020YQ10/Research and Development
- 31670831/Research and Development
- Shanghai Jiao Tong University
- 21907065 31670831 31900112 31970130 81971909/National Natural Science Foundation of China
LinkOut - more resources
Full Text Sources
Medical
Miscellaneous


