Identification of Cooperative Gene Regulation Among Transcription Factors, LncRNAs, and MicroRNAs in Diabetic Nephropathy Progression - PubMed (original) (raw)
Identification of Cooperative Gene Regulation Among Transcription Factors, LncRNAs, and MicroRNAs in Diabetic Nephropathy Progression
Ling Chen et al. Front Genet. 2020.
Abstract
The pathogenesis of diabetic nephropathy (DN) is accompanied by alterations in biological function and signaling pathways regulated through complex molecular mechanisms. A number of regulatory factors, including transcription factors (TFs) and non-coding RNAs (ncRNAs, including lncRNAs and miRNAs), have been implicated in DN; however, it is unclear how the interactions among these regulatory factors contribute to the development of DN pathogenesis. In this study, we developed a network-based analysis to decipher interplays between TFs and ncRNAs regulating progression of DN by combining omics data with regulatory factor-target information. To accomplish this, we identified differential expression programs of mRNAs and miRNAs during early DN (EDN) and established DN. We then uncovered putative interactive connections among miRNA-mRNA, lncRNA-miRNA, and lncRNA-mRNA implicated in transcriptional control. This led to the identification of two lncRNAs (MALAT1 and NEAT1) and the three TFs (NF-κB, NFE2L2, and PPARG) that likely cooperate with a set of miRNAs to modulate EDN and DN target genes. The results highlight how crosstalk among TFs, lncRNAs, and miRNAs regulate the expression of genes both transcriptionally and post-transcriptionally, and our findings provide new insights into the molecular basis and pathogenesis of progressive DN.
Keywords: diabetic nephropathy; long non-coding RNAs; microRNAs; regulatory interactions; transcription factors.
Copyright © 2020 Chen, Wu, Wang, Xiong, Zhou, Cheng, Zhou, Luo, Lam, Yan and Chen.
Figures
FIGURE 1
A pipeline analysis to identify interactions among TFs, lncRNAs, miRNAs, and mRNAs under DN. It includes three steps: (1) calculation of co-expression interactions between miRNAs and mRNAs from PCC analysis of DEG and DEM expression profiles obtained from EDN and DN datasets; (2) determination of interactive links among lncRNA–mRNAs or lncRNA–miRNAs generated by searching for lncRNA-targets (miRNA and mRNA) and miRNA–mRNAs; and (3) identification of TF–lncRNA–miRNA gene regulatory networks built from information generated in steps 1 and 2 and integrated with TF binding target data. PCC, Pearson correlation coefficient; DEG, differentially expressed genes/mRNAs; DEMs, differentially expressed miRNAs.
FIGURE 2
Differential expression profiles of mRNAs during EDN and DN. (A) a Venn diagram showing differentially expressed genes/mRNAs (DEGs) identified from two transcriptomic datasets of EDN. (B) Graph showing significant biological functions under EDN. (C) A Venn diagram showing DEGs identified from four transcriptomic datasets of DN. (D) Graph showing significant biological functions under DN. (E) A Venn diagram showing overlapping between EDN and DN. The “2, 3, and 4 overlaps” represents intersection of two, three, and four DN datasets, respectively. (F) Significantly enriched biological function of overlapped DEGs between EDN and DN. The number on each bar represents number of overlapped DEGs within this function category. In A, C, and E, numbers in the parentheses refer to number of DEGs with fold change at least 2.0.
FIGURE 3
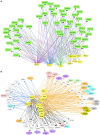
Differential expression profiles of miRNAs during DN. (A) Venn diagram showing differentially expressed miRNAs (DEMs) identified from two miRNA expression data of DN. There were two datasets from E-MTAB-4166 and Cardenas-Gonzalez et al. (2017). (B) Venn diagram showing overlap between the four miRNA expression datasets from Figure 2A and reported miRNAs from Supplementary Table S1. (C) a miRNA–mRNA interactive network. Blue, orange, and black/gray edges indicate miRNA–mRNA interactions identified under EDN, DN, and EDN + DN conditions, respectively, where black and gray edges also represent interactions generated based on miRNA target + PCC and only PCC, respectively. Circle nodes represent the DEGs involving biological processes apoptosis (light blue), angiogenesis (red), inflammation (orange), immune response (light green), and transcriptional regulation (purple).
FIGURE 4
Interactive networks of lncRNA-targets (miRNAs or mRNAs) during DN. (A) Interactive networks of lncRNA–miRNAs. (B) Interactive networks of lncRNA–mRNAs under EDN and DN. Blue, orange, and black edges indicate lncRNA–mRNA interactions identified under EDN, DN, and EDN + DN conditions, respectively. Yellow nodes stand for lncRNAs. Circle nodes represent the DEGs involving biological processes apoptosis (light blue), angiogenesis (red), inflammation (orange), immune response (light green), cell cycle (brown), and transcriptional regulation (purple).
FIGURE 5
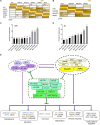
Interactive networks of TF–lncRNA–miRNA–mRNA under DN. (A) Pairwise comparison of TF targets based on enrichment _p_-value of TF target overlapping. The darker the color, the lower the _p_-value. (B) Pairwise comparison of lncRNA targets based on enrichment _p_-value of lncRNA target overlapping. (C,D) Comparison of the target DEGs of TFs and lncRNAs by calculating enrichment _p_-value under EDN (C) and DN (D). Y axis refers to overlapped number of target genes. (E) a model showing multi-level regulatory relationships among TFs, lncRNAs, miRNAs, and downstream target genes. Yellow and purple nodes stand for lncRNAs and TFs, respectively. Genes in blue, orange, and black fonts indicate DEGs under EDN, DN, and EDN + DN, respectively. *, **, and *** indicate enrichment p < 10–2, 10–4, and 10–6, respectively.
Similar articles
- Interactions Among Non-Coding RNAs in Diabetic Nephropathy.
Loganathan TS, Sulaiman SA, Abdul Murad NA, Shah SA, Abdul Gafor AH, Jamal R, Abdullah N. Loganathan TS, et al. Front Pharmacol. 2020 Mar 3;11:191. doi: 10.3389/fphar.2020.00191. eCollection 2020. Front Pharmacol. 2020. PMID: 32194418 Free PMC article. Review. - Microarray analysis of long noncoding RNA expression patterns in diabetic nephropathy.
Chen S, Dong C, Qian X, Huang S, Feng Y, Ye X, Miao H, You Q, Lu Y, Ding D. Chen S, et al. J Diabetes Complications. 2017 Mar;31(3):569-576. doi: 10.1016/j.jdiacomp.2016.11.017. Epub 2016 Dec 8. J Diabetes Complications. 2017. PMID: 28007334 - Construction and analysis of mRNA, miRNA, lncRNA, and TF regulatory networks reveal the key genes associated with prostate cancer.
Ye Y, Li SL, Wang SY. Ye Y, et al. PLoS One. 2018 Aug 23;13(8):e0198055. doi: 10.1371/journal.pone.0198055. eCollection 2018. PLoS One. 2018. PMID: 30138363 Free PMC article. - The topological key lncRNA H2k2 from the ceRNA network promotes mesangial cell proliferation in diabetic nephropathy via the miR-449a/b/Trim11/Mek signaling pathway.
Chen W, Peng R, Sun Y, Liu H, Zhang L, Peng H, Zhang Z. Chen W, et al. FASEB J. 2019 Oct;33(10):11492-11506. doi: 10.1096/fj.201900522R. Epub 2019 Jul 23. FASEB J. 2019. PMID: 31336052 - MicroRNA: A new generation therapeutic target in diabetic nephropathy.
Dewanjee S, Bhattacharjee N. Dewanjee S, et al. Biochem Pharmacol. 2018 Sep;155:32-47. doi: 10.1016/j.bcp.2018.06.017. Epub 2018 Jun 22. Biochem Pharmacol. 2018. PMID: 29940170 Review.
Cited by
- Using network pharmacology to explore the mechanism of Danggui-Shaoyao-San in the treatment of diabetic kidney disease.
Yang J, Li C, Liu Y, Han Y, Zhao H, Luo S, Zhao C, Jiang N, Yang M, Sun L. Yang J, et al. Front Pharmacol. 2022 Aug 19;13:832299. doi: 10.3389/fphar.2022.832299. eCollection 2022. Front Pharmacol. 2022. PMID: 36059953 Free PMC article. - LncRNA NEAT1 and MALAT1 are involved in polycystic ovary syndrome pathogenesis by functioning as competing endogenous RNAs to control the expression of PCOS-related target genes.
ElMonier AA, El-Boghdady NA, Fahim SA, Sabry D, Elsetohy KA, Shaheen AA. ElMonier AA, et al. Noncoding RNA Res. 2023 Mar 3;8(2):263-271. doi: 10.1016/j.ncrna.2023.02.008. eCollection 2023 Jun. Noncoding RNA Res. 2023. PMID: 36935861 Free PMC article. - Long non‑coding RNA L13Rik promotes high glucose-induced mesangial cell hypertrophy and matrix protein expression by regulating miR-2861/CDKN1B axis.
Sun L, Ding M, Chen F, Zhu D, Xie X. Sun L, et al. PeerJ. 2023 Oct 16;11:e16170. doi: 10.7717/peerj.16170. eCollection 2023. PeerJ. 2023. PMID: 37868060 Free PMC article. - Identification of novel key genes and potential candidate small molecule drugs in diabetic kidney disease using comprehensive bioinformatics analysis.
Li B, Ye S, Fan Y, Lin Y, Li S, Peng H, Diao H, Chen W. Li B, et al. Front Genet. 2022 Aug 12;13:934555. doi: 10.3389/fgene.2022.934555. eCollection 2022. Front Genet. 2022. PMID: 36035169 Free PMC article. - Genome-wide analysis of long noncoding RNAs as cis-acting regulators of transcription factor-encoding genes in IgA nephropathy.
Zhai Y, Tian H, Zhang W, Sun S, Zhao Z. Zhai Y, et al. PLoS One. 2024 May 24;19(5):e0304301. doi: 10.1371/journal.pone.0304301. eCollection 2024. PLoS One. 2024. PMID: 38787831 Free PMC article.
References
- Cardenas-Gonzalez M., Srivastava A., Pavkovic M., Bijol V., Rennke H. G., Stillman I. E., et al. (2017). Identification, confirmation, and replication of novel urinary microrna biomarkers in lupus nephritis and diabetic nephropathy. Clin. Chem. 63 1515–1526. 10.1373/clinchem.2017.274175 - DOI - PMC - PubMed
LinkOut - more resources
Full Text Sources


